🌍 Public
2025 Lawn Viz
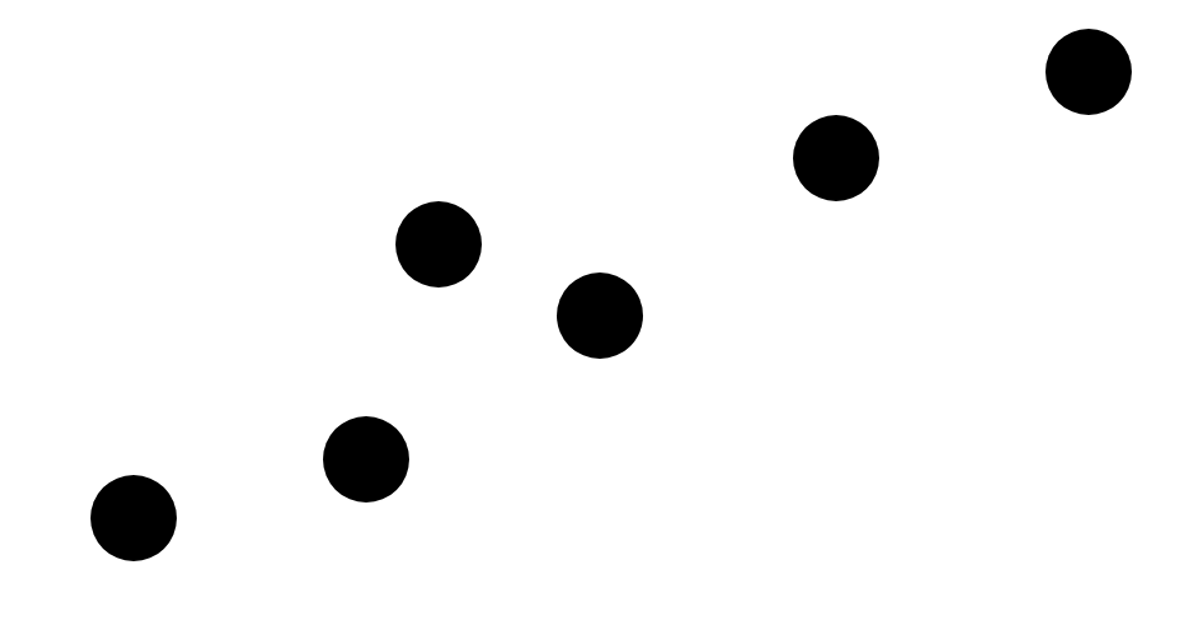
A pseudo-plotted chart displays six gray circles at irregular positions against a white background, evoking a hand-drawn scatterplot without explicit axes or data points. The visualization uses raw SVG elements, with each circle defined by explicit `cx`, `cy`, and `r` attributes, and rendered via the `index.html` file. All circles share the same fill color (`#D9D9D9`) and radius (30). The layout suggests a playful or abstract representation of plotted data, relying purely on static SVG positioning rather than any dynamic data binding or interaction. The example is generated from a simple HTML structure with inline SVG, containing no external libraries or JavaScript logic.
AI-generated descriptionPseudo Plot chart
MIT Licensed


Comments
Sign in to join the discussion.