🌍 Public
Fork of Sol LeWitt Reproduction with D3
A D3.js SVG bar chart displays nine rectangular bars with numerical labels, representing a simple dataset. The chart uses D3's selection and joining methods to create rectangles and text elements, with computed x, y, width, and height attributes from data values. The visualization shows a basic bar chart layout with spacing between bars and labels positioned above each bar. The code leverages D3's data-driven approach to generate chart marks programmatically.
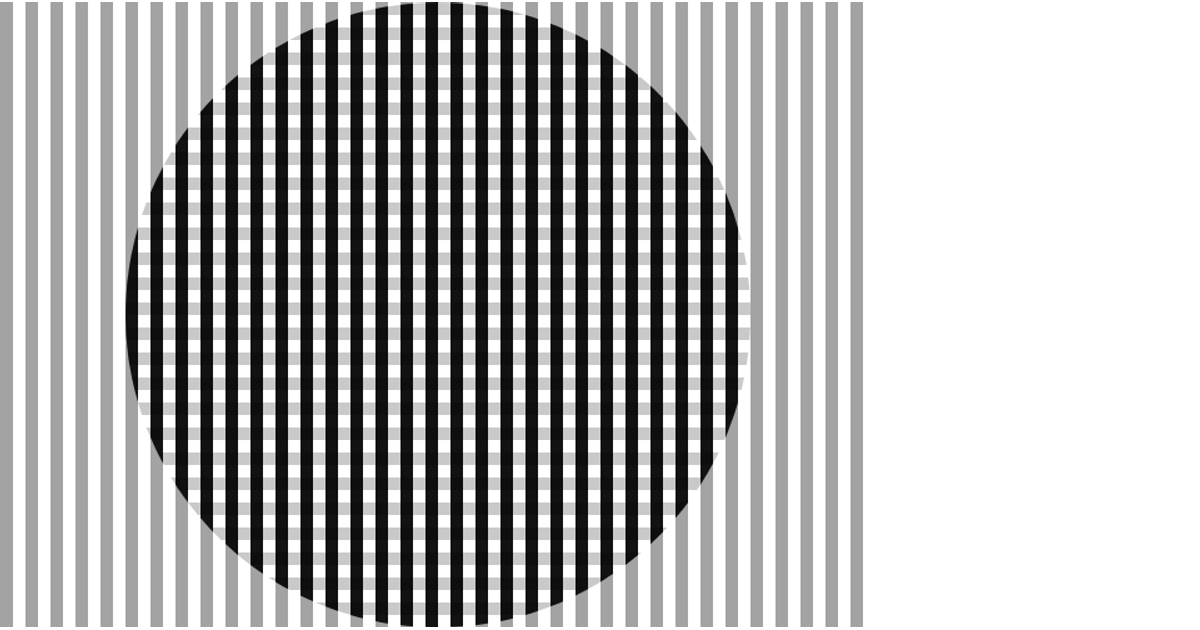
AI-generated descriptionA reproduction of a Sol LeWitt art piece.
MIT Licensed



Comments
Sign in to join the discussion.