🌍 Public
309551125
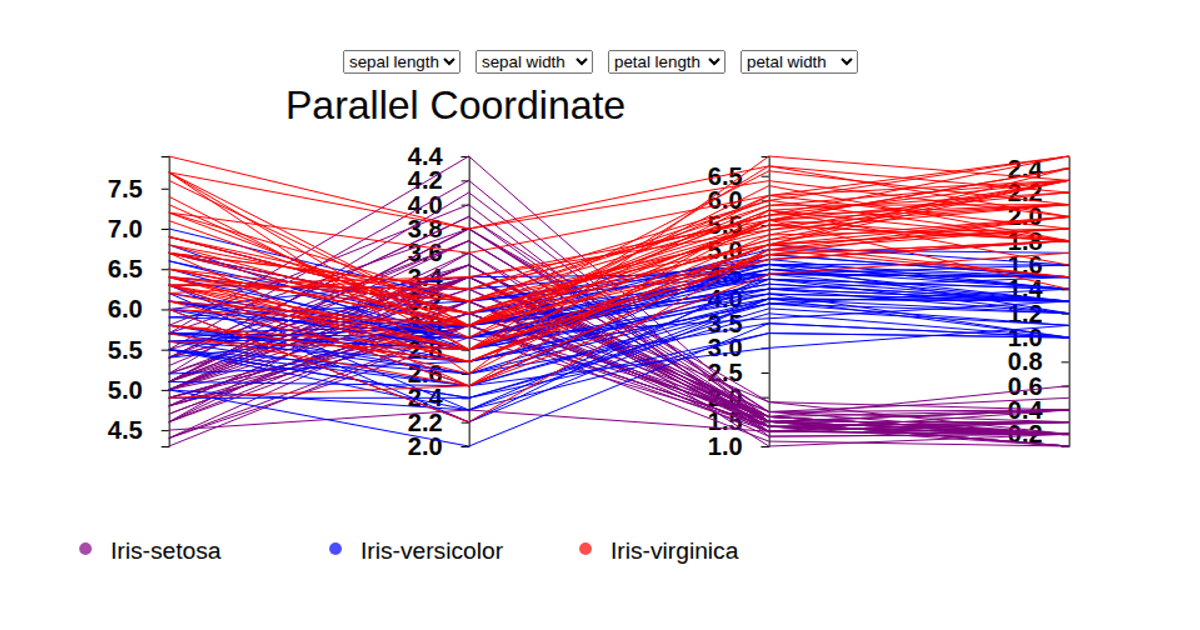
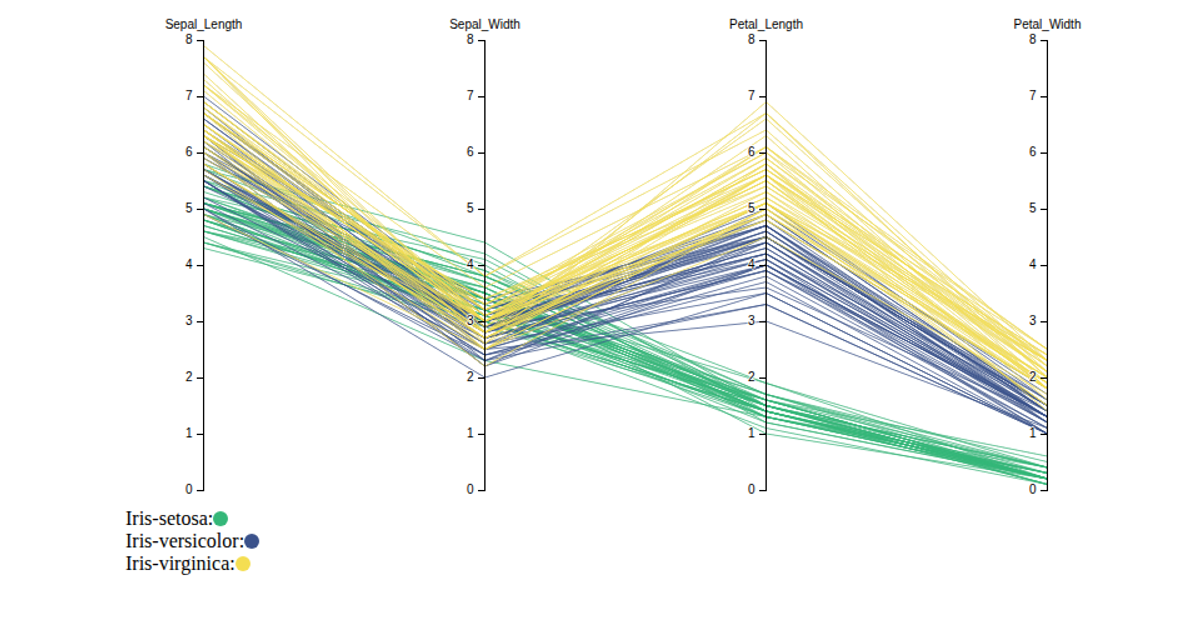
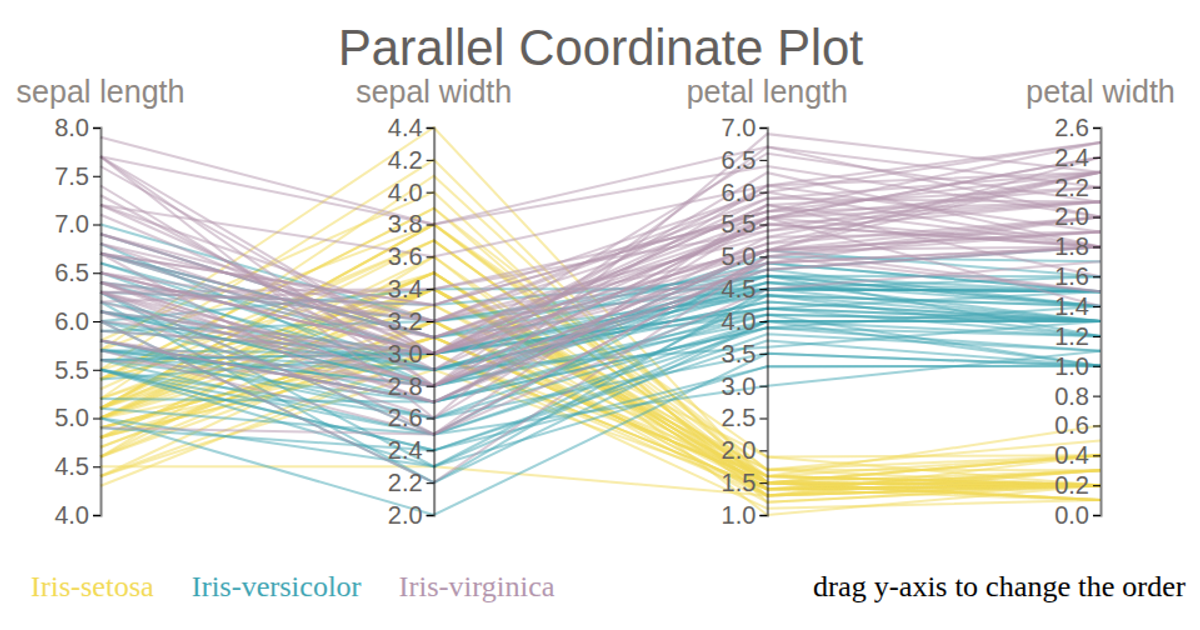
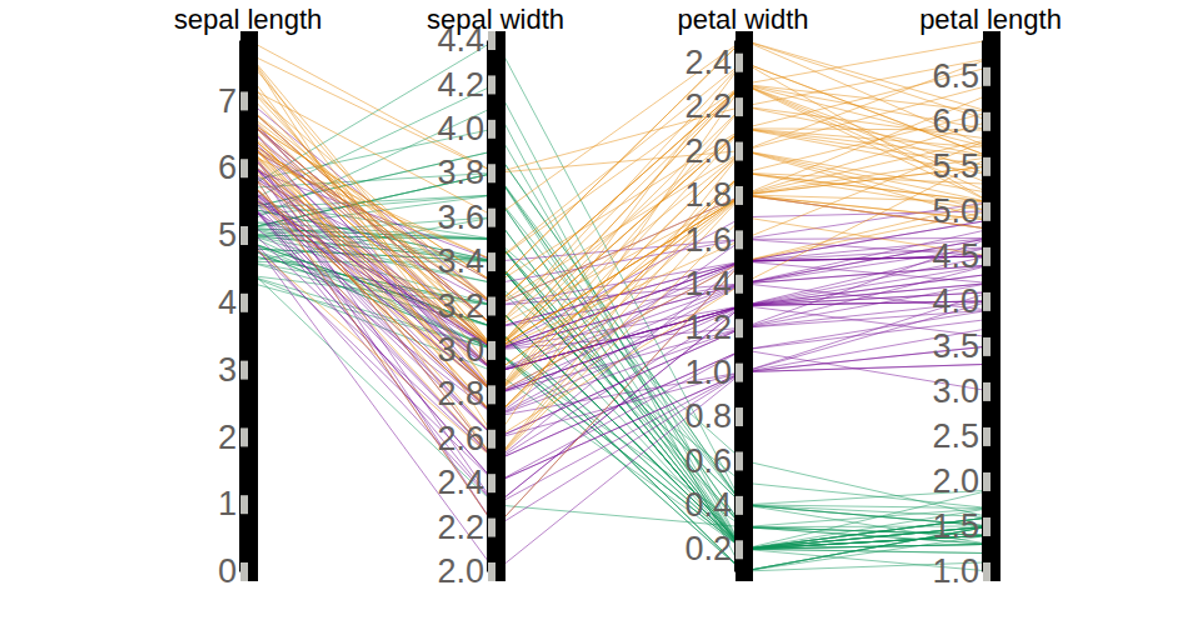
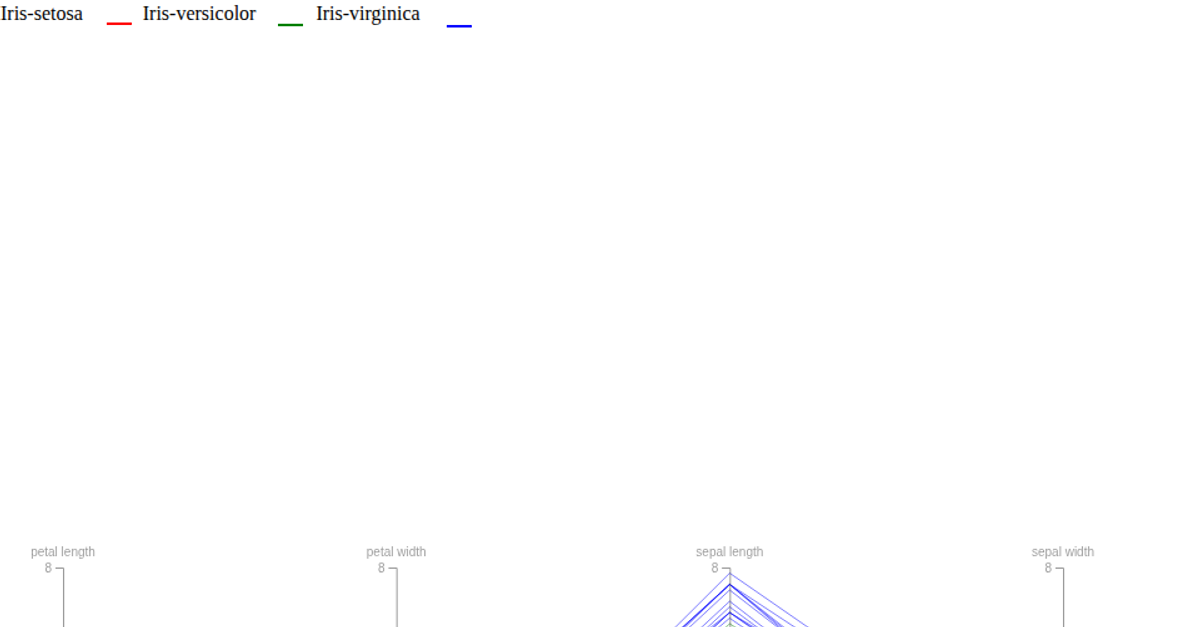
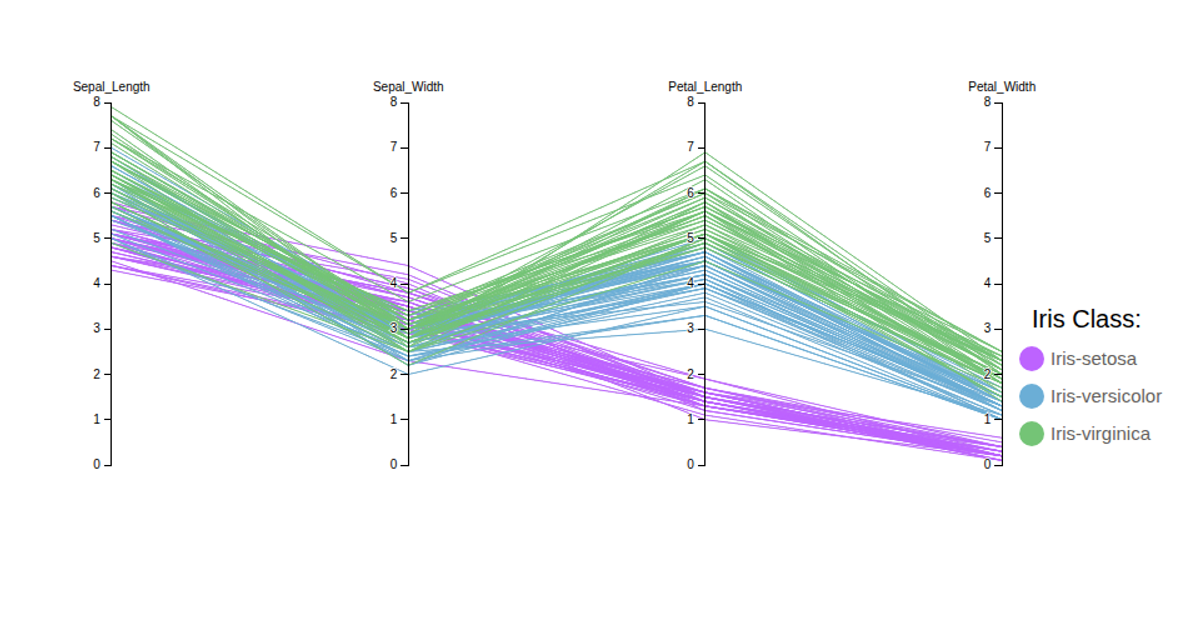
A parallel coordinate plot of the Iris dataset displays 150 flowers across four draggable axes, with each species colored red, green, or blue. The visualization uses `d3.csv` to load data, `d3.scaleLinear` for coordinate mapping, and SVG elements (`circle`, `line`) for rendering. Users can reorder axes via dropdown menus, which trigger the `switch_coordinate` function to update axis labels and redraw the plot.
AI-generated descriptionMIT Licensed

Comments
Sign in to join the discussion.