🌍 Public
Running Total of TMDb Movies by Year
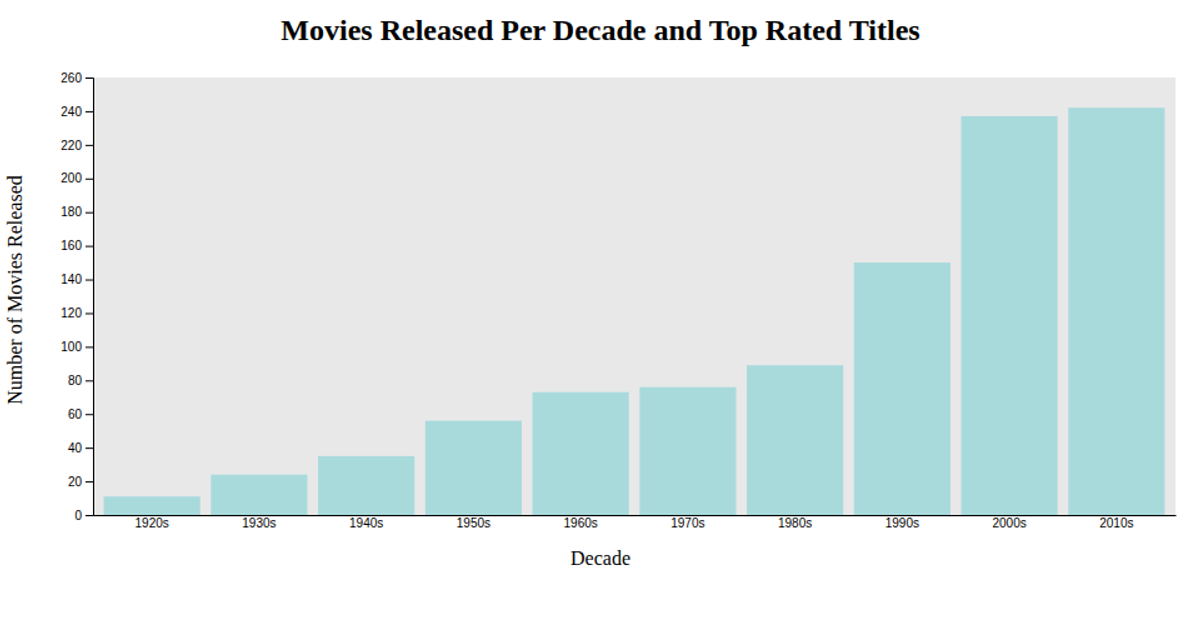
This visualization shows the cumulative running total of TMDb movies by year, with each red bar representing the accumulated count up to that year. The data, loaded from a CSV file, is rendered as an SVG bar chart using D3.js. The code uses `d3.scaleTime()`, `d3.timeParse()`, and `d3.axisBottom()` to handle time-based axes and formatting, with the y-axis displaying the running totals.
AI-generated descriptionA bare minimum HTML page demonstrating use of CSS and JavaScript.
See also React Starter.
MIT Licensed




Comments
Sign in to join the discussion.