🌍 Public
Fork of Activity 7 Scatter Plot
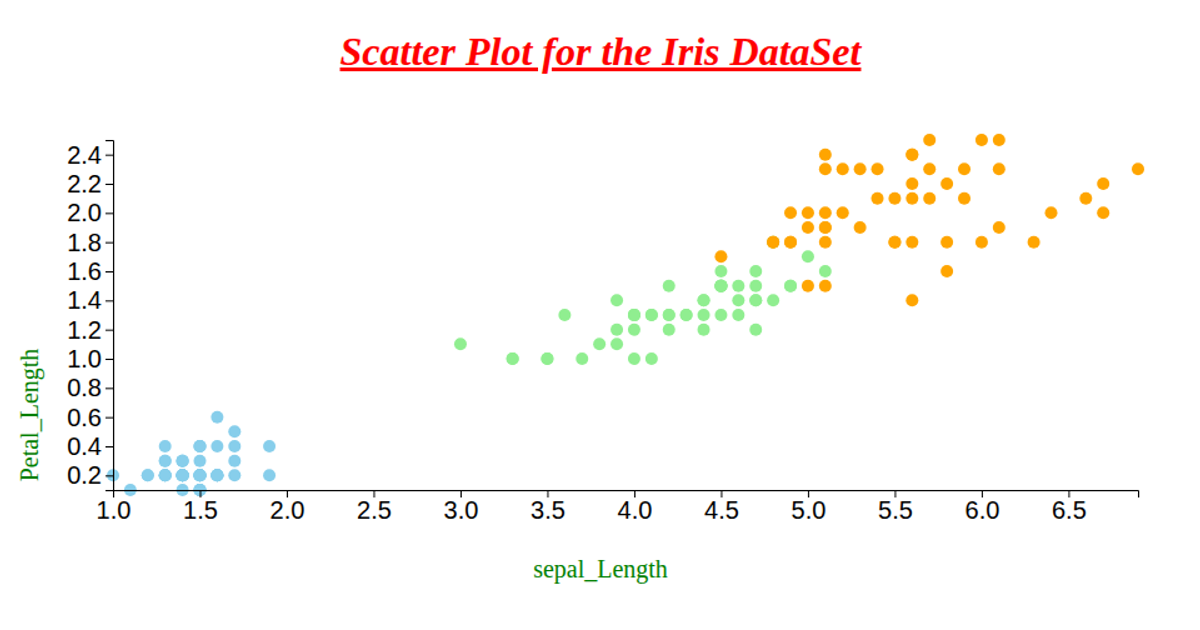
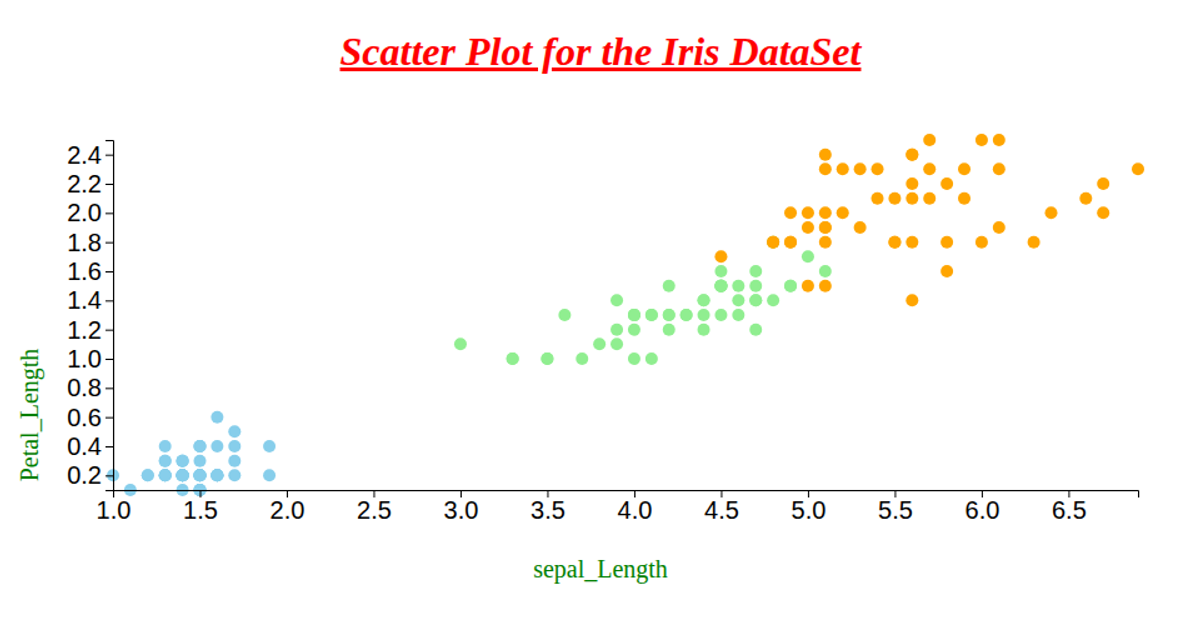
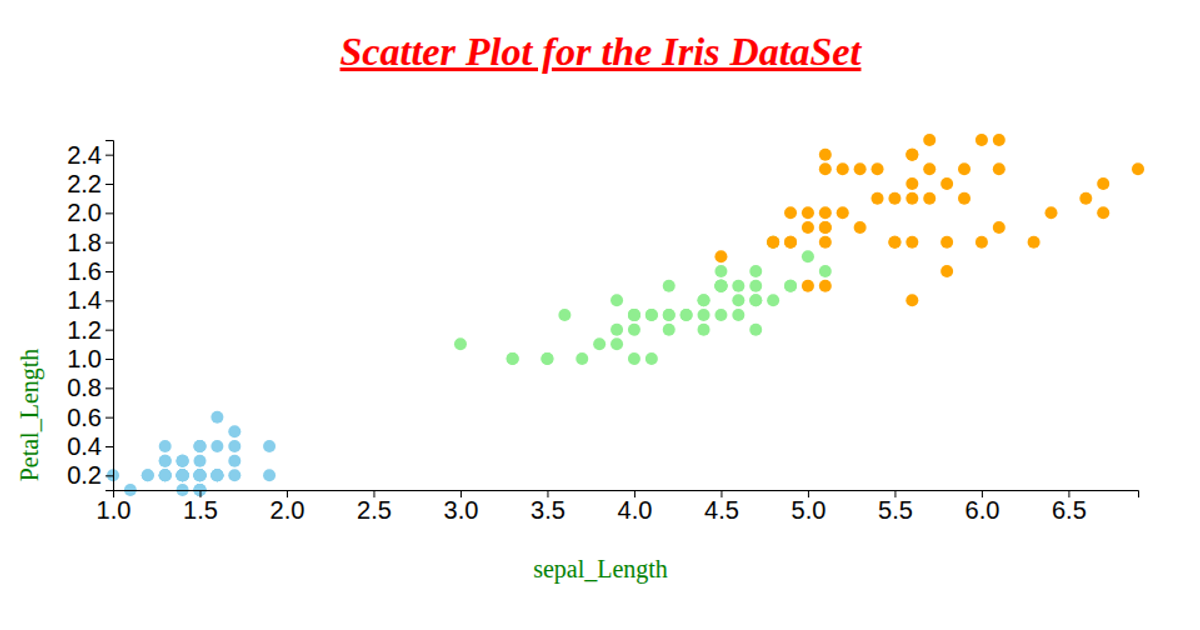
This fork of Activity 7 displays the Iris dataset in a scatter plot, comparing sepal length against petal length. Points are colored by species using a custom color mapping in the `index.html` data preparation. The visualization is built with the Observable-style `d3` API, using `d3.scaleLinear` for axes and `d3.scaleOrdinal` for categorical colors. Data is loaded via `d3.csv` from a remote Gist, and the plot is rendered into an SVG container styled with CSS.
AI-generated descriptionWe are Displaying the IRIS dataset using Scatter plot.
MIT Licensed



Comments
Sign in to join the discussion.