🌍 Public
Customize Axis
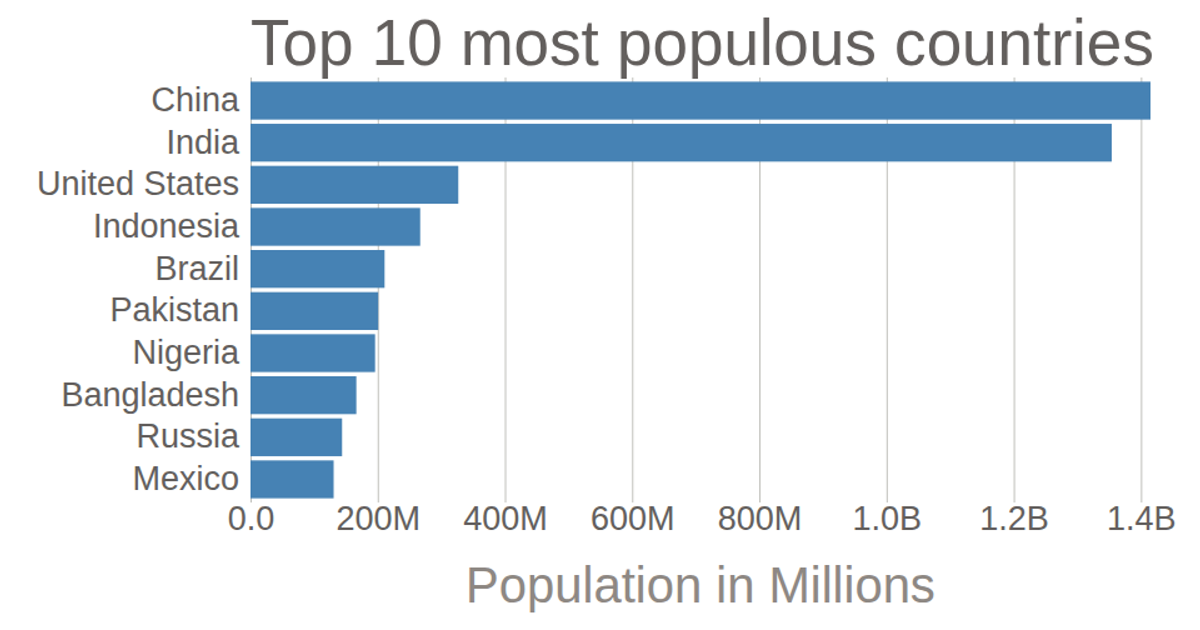
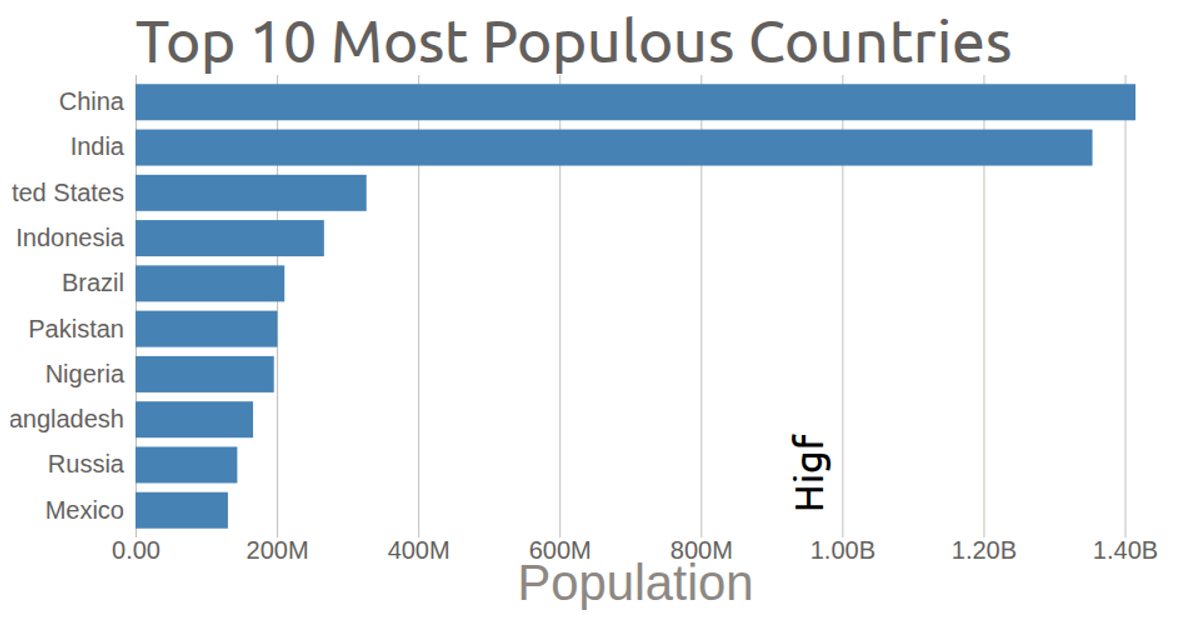
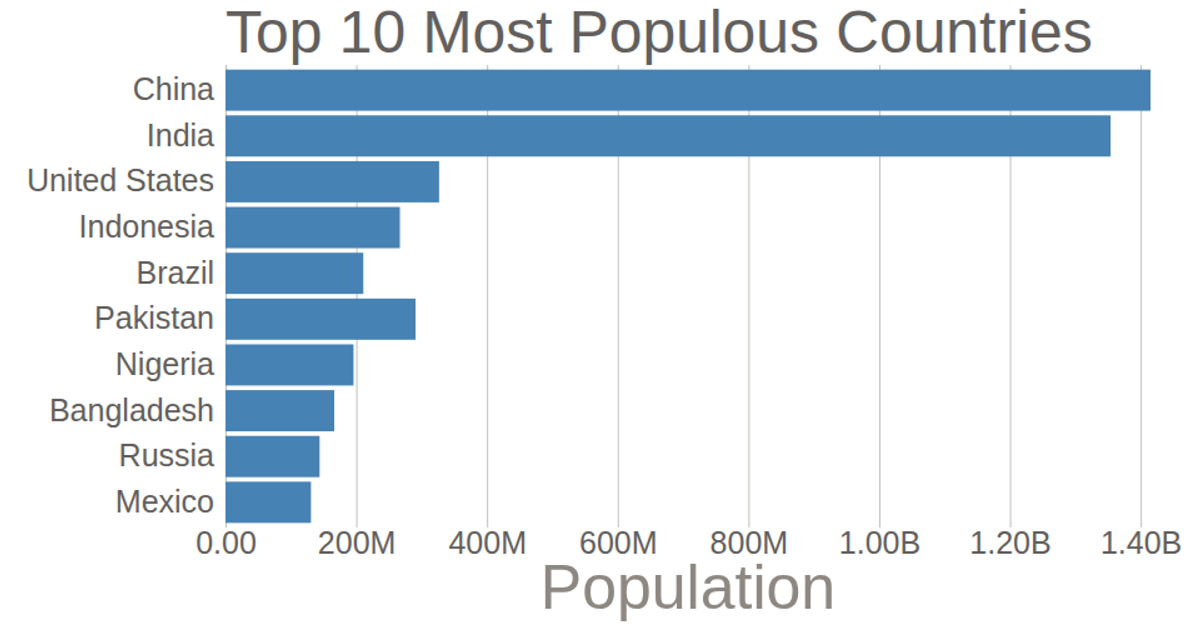
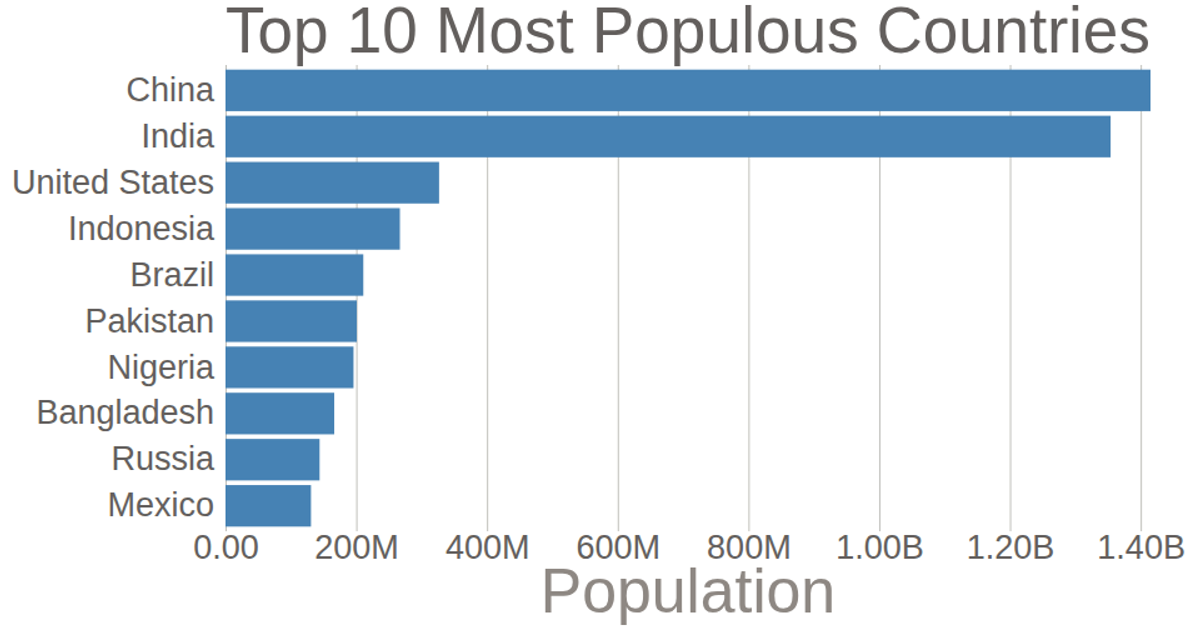
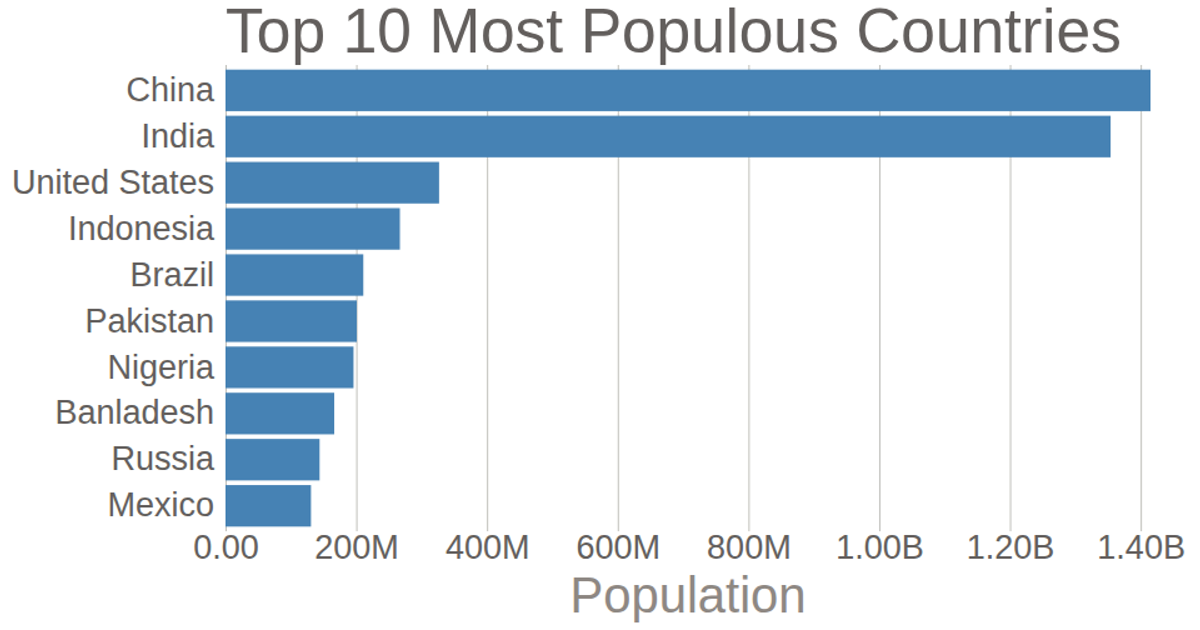
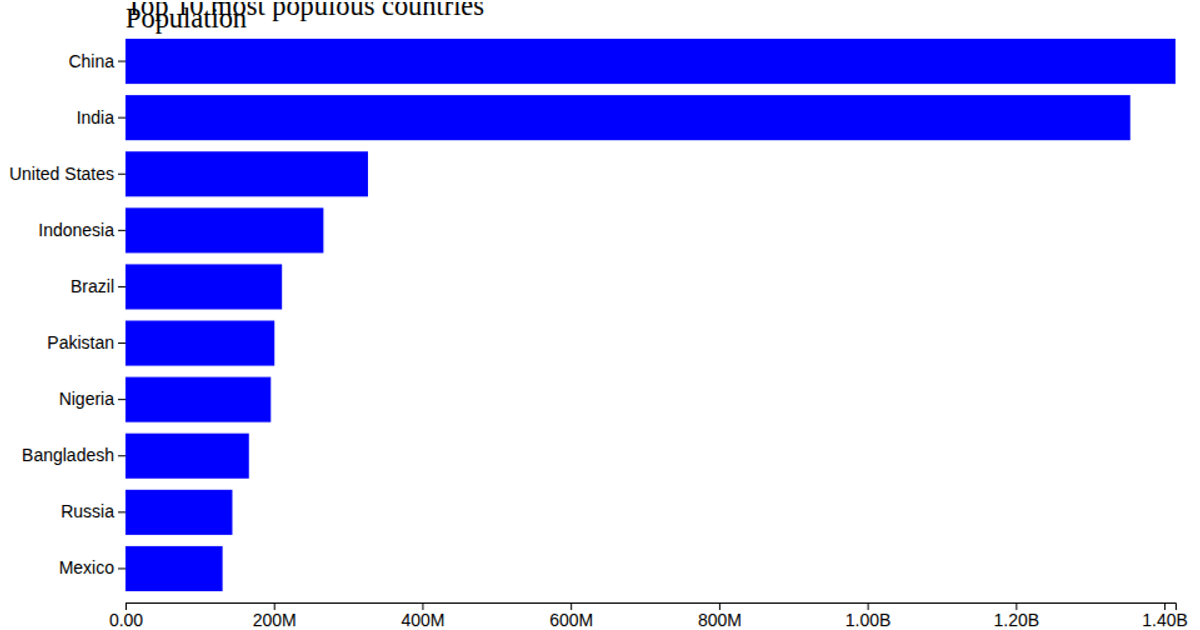
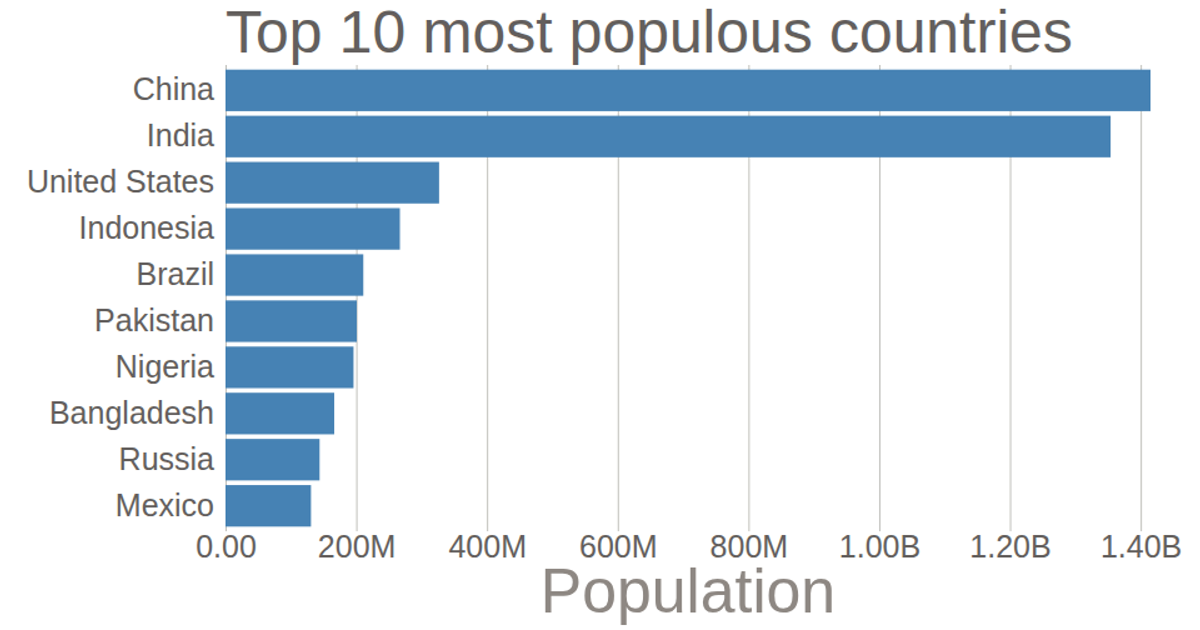
This example displays a horizontal bar chart of the populations of the top ten most populous countries, with a customized axis. D3’s `axisBottom` and `axisLeft` are used to generate the scales, with the x-axis formatted via `tickFormat` to abbreviate numbers and replace 'G' with 'B'. Grid lines are extended using `tickSize`, while axis domains are removed. The chart renders as an SVG and reads data from a CSV file.
AI-generated descriptionMIT Licensed

Comments
Sign in to join the discussion.