🌍 Public
Missing and dead migrants II
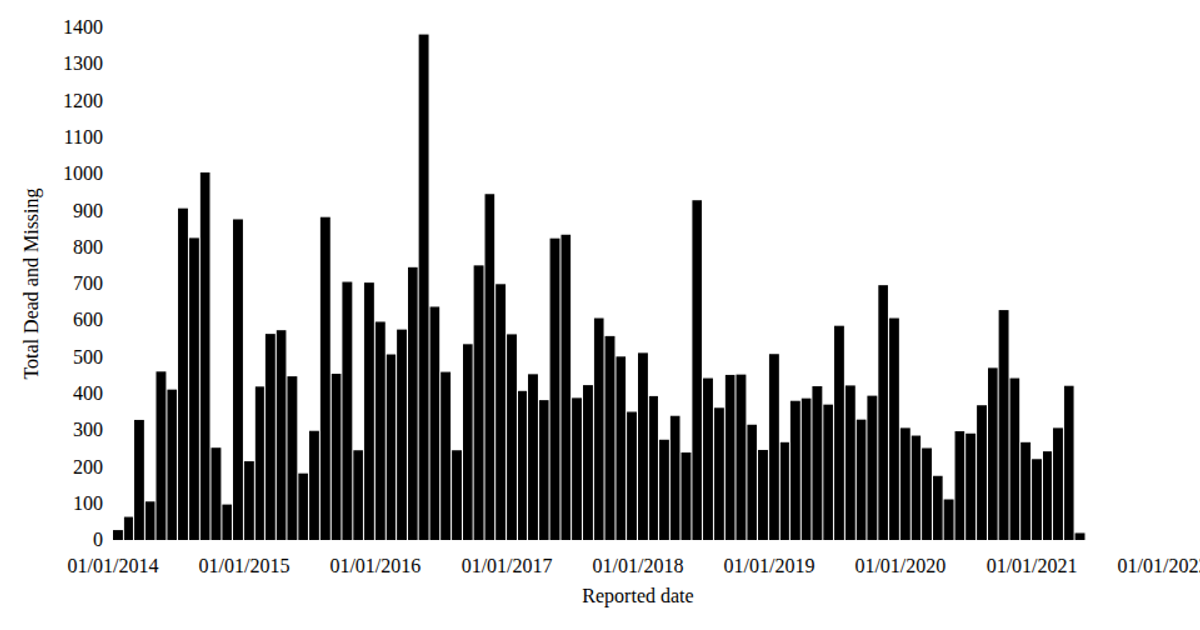
This visualization presents a bar chart of the total number of dead and missing migrants aggregated by month. The code bins the raw data using `d3.bin` and `d3.timeMonths`, calculates the sum per bin, and renders the result as SVG rectangles via React, using D3 scales for positioning. The chart uses the Missing Migrants Dataset from a GitHub gist. Tooltips expose the precise dead and missing count for each month.
AI-generated descriptionMIT Licensed


Comments
Sign in to join the discussion.