🌍 Public
ACT(6) HISTOGRAM
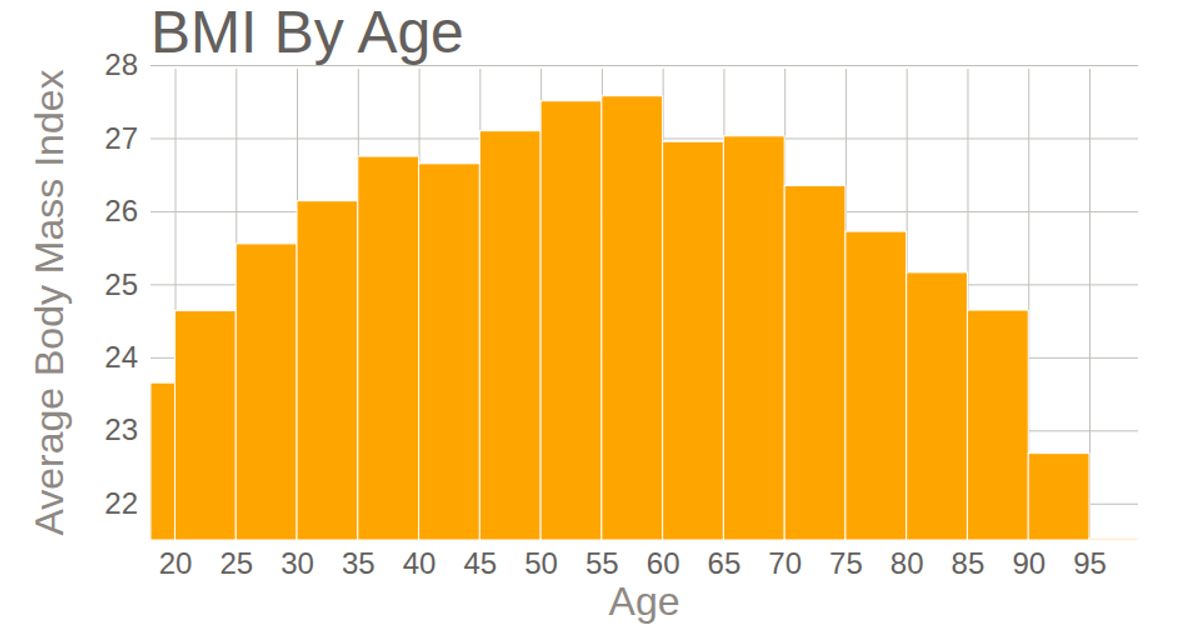
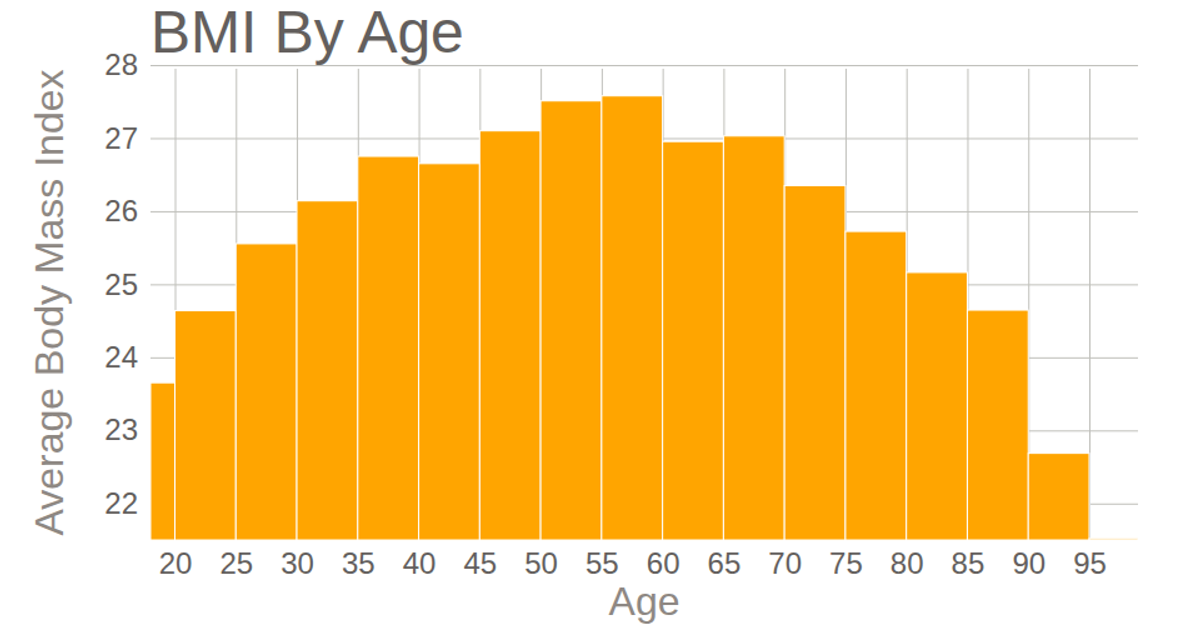
This histogram visualizes the relationship between age and average Body Mass Index (BMI) from health survey data, showing BMI distribution across age bins. The chart displays age on the x-axis and average BMI on the y-axis using orange rectangular bars. The code loads data via a CSV URL, converts string values to numbers, and computes BMI from height and weight fields. It uses D3 v7 APIs including `d3.csv`, `d3.bin`, `d3.scaleLinear`, `d3.axisBottom`, and `d3.axisLeft`. The visualization is rendered as an SVG with custom styling for ticks and labels.
AI-generated descriptionAn example showing the capabilities of VizHub:
- Loads D3 via UNPKG.
- Demonstrates use of
importfrom"d3". - Demonstrates use of
importfrom local ES6 modules.
MIT Licensed



Comments
Sign in to join the discussion.