🌍 Public
Lokesh_ICE_6_ScatterPlot_Penguin_Data
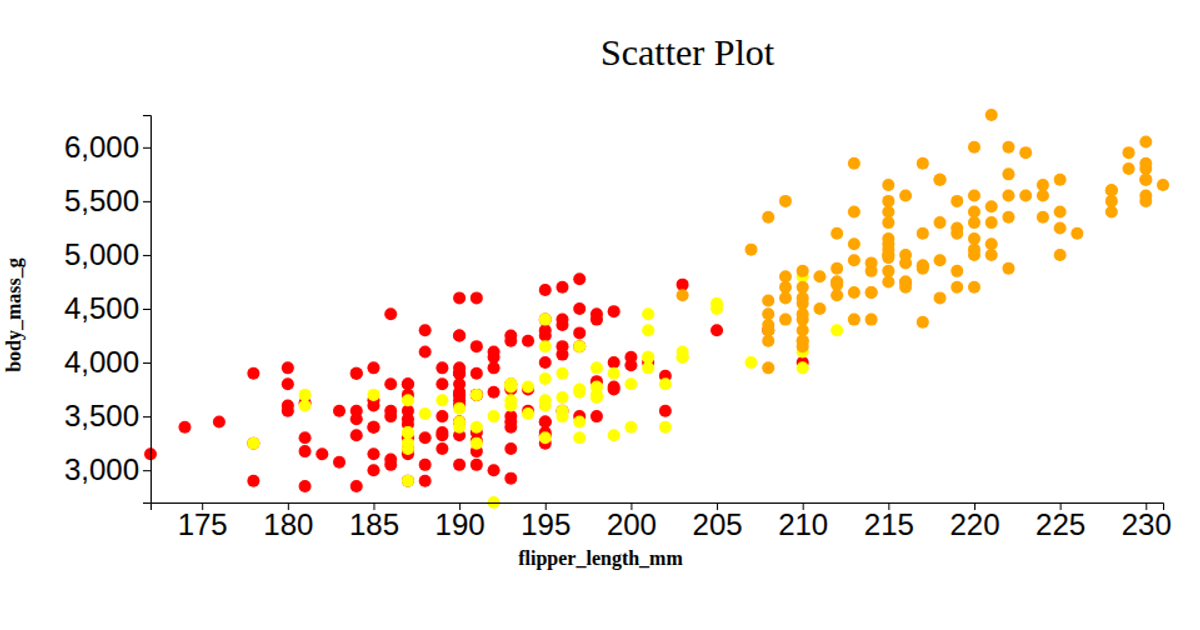
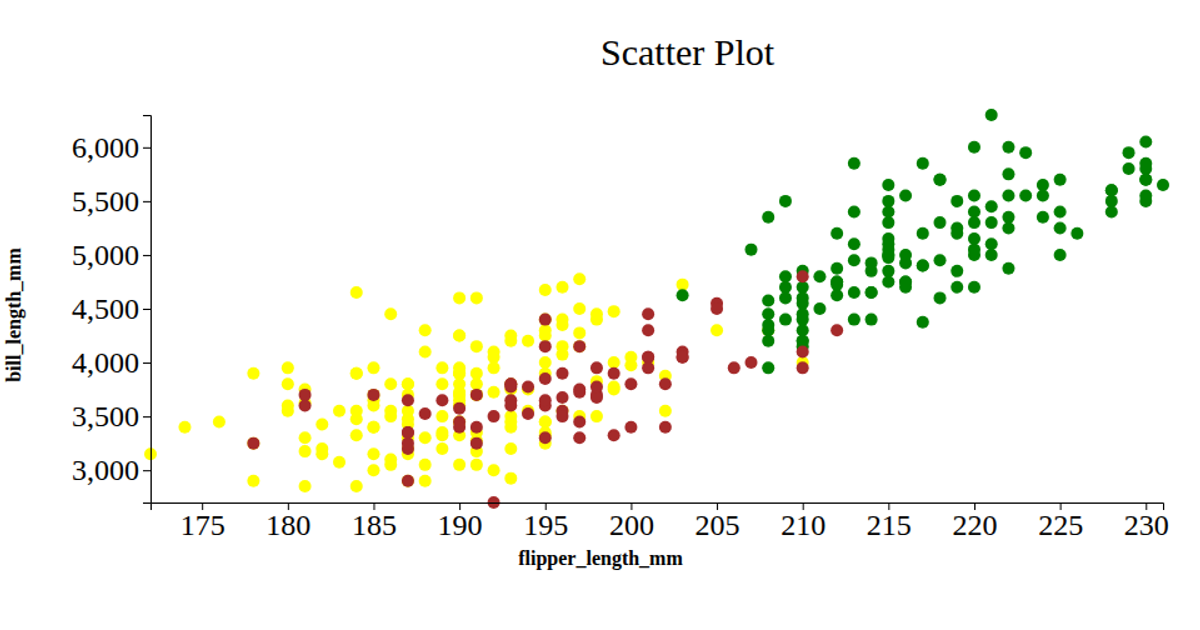
This scatter plot visualizes the relationship between flipper length and body mass for three penguin species, using color to distinguish Adelie, Chinstrap, and Gentoo penguins. The visualization loads a CSV dataset and uses D3 v5 scaleLinear, extent, axisLeft, and axisBottom to map data to SVG circles within a React framework.
AI-generated descriptionA bare minimum HTML page demonstrating use of CSS and JavaScript.
See also React Starter.
MIT Licensed




Comments
Sign in to join the discussion.