🌍 Public
In Class Assignment 6
NNHRK555
Last edited Jun 26, 2022
Created on Jun 25, 2022
Forked from Fork of Data Visualization - ICE-6 - Bar chart
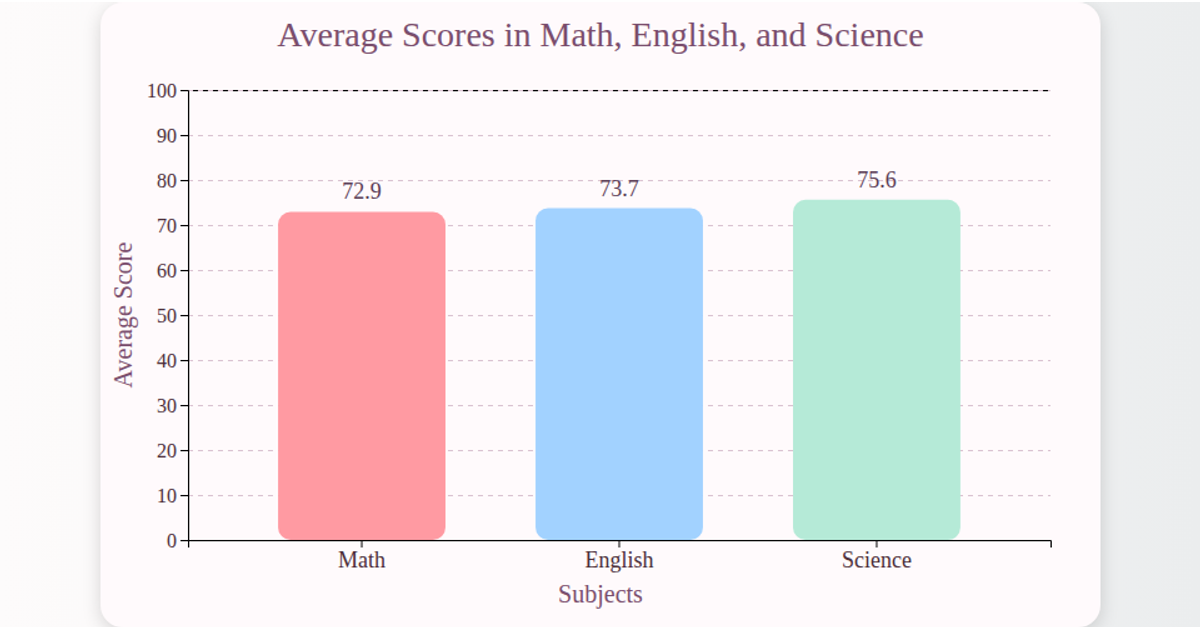
This visualization shows the average pass percentage for each school section in 2021 using a horizontal bar chart. It displays section names on the y-axis and percentage values on the x-axis with red grid lines. The chart is built with React and D3 v5, using `scaleBand` for the y-axis, `scaleLinear` for the x-axis, and SVG `rect` elements for bars. Data is loaded asynchronously from a CSV file via `d3.csv`, and the visualization renders in an SVG container with a grey background.
AI-generated descriptionMIT Licensed





Comments
Sign in to join the discussion.