🌍 Public
ICE 8 -Japan Map
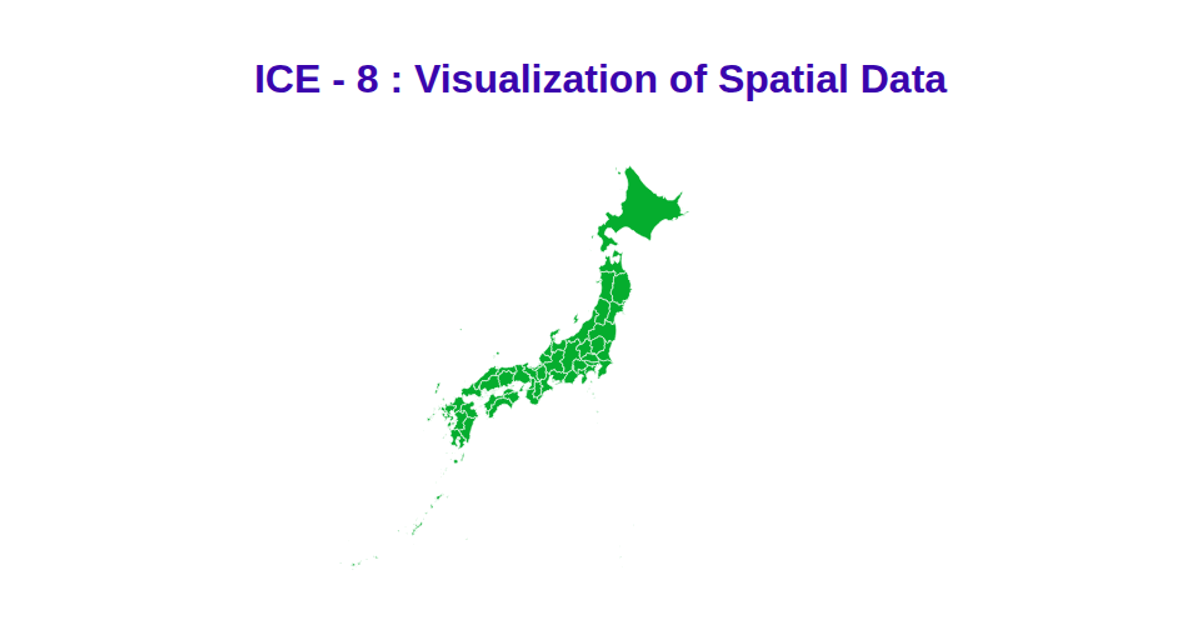
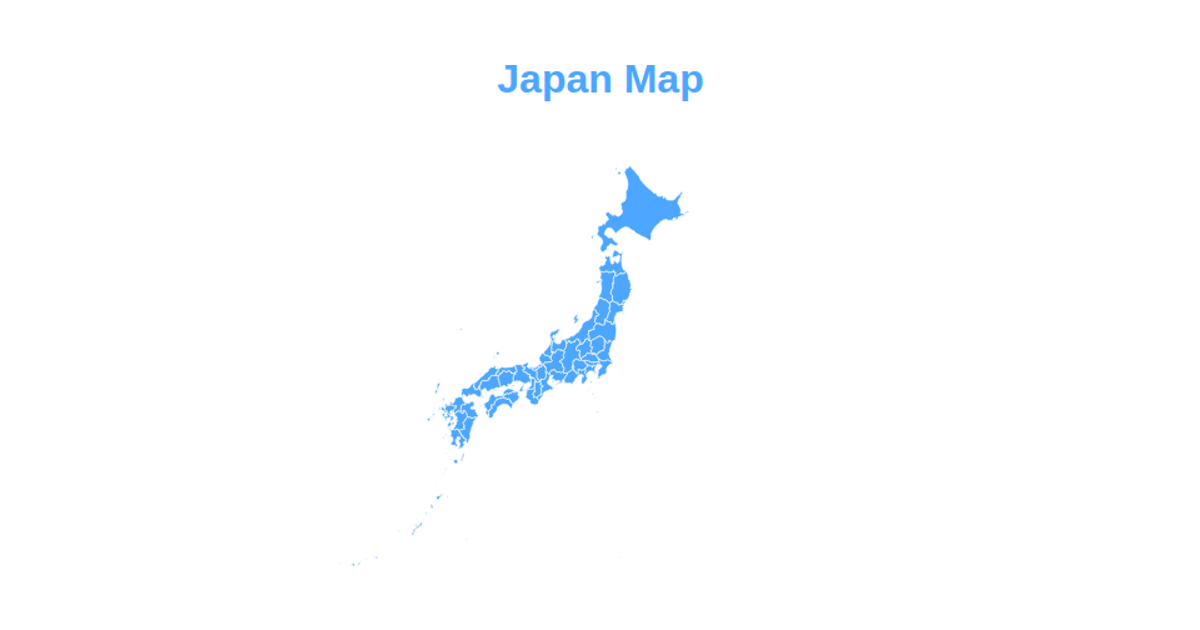
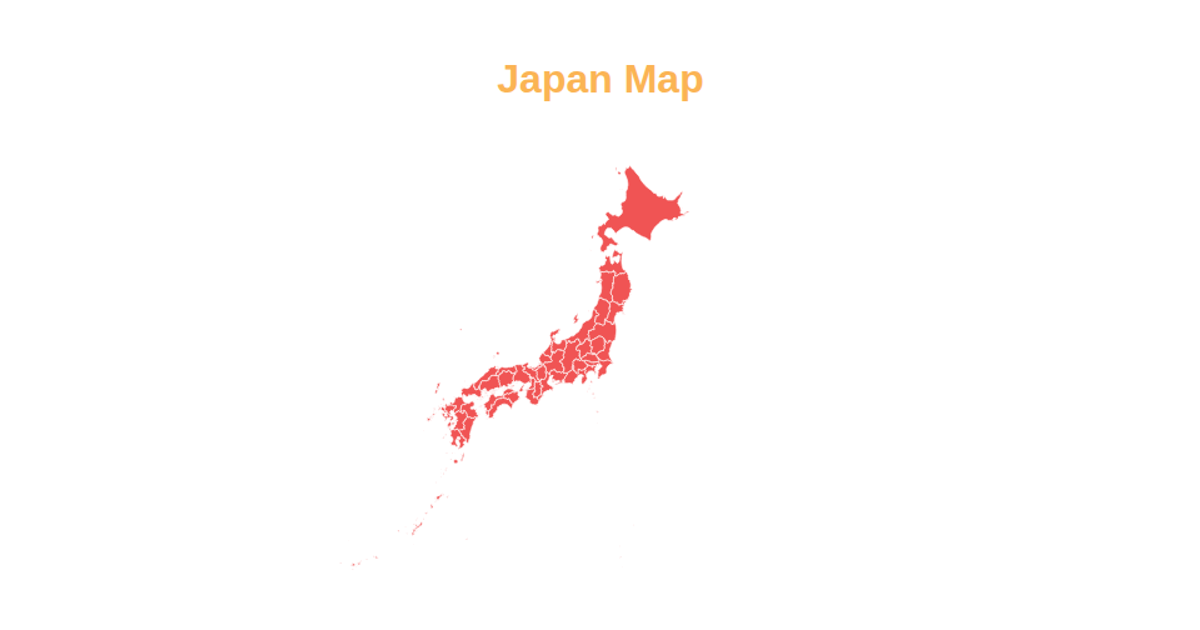
This example displays a choropleth-free map of Japan’s prefectures, using skyblue fill and red strokes to delineate administrative boundaries. Built with D3.js, it employs `d3.geoMercator` projection, `d3.geoPath` for path generation, and `d3.zoom` for interactive pan and zoom. The geographic data is loaded from a TopoJSON file via `topojson.feature`, and `d3.scaleOrdinal` assigns categorical colors. The SVG-based visualization renders state-level polygons from the `JPN_adm1` layer.
AI-generated descriptionMIT Licensed



Comments
Sign in to join the discussion.