🌍 Public
Fork of Fork of D3 Starter
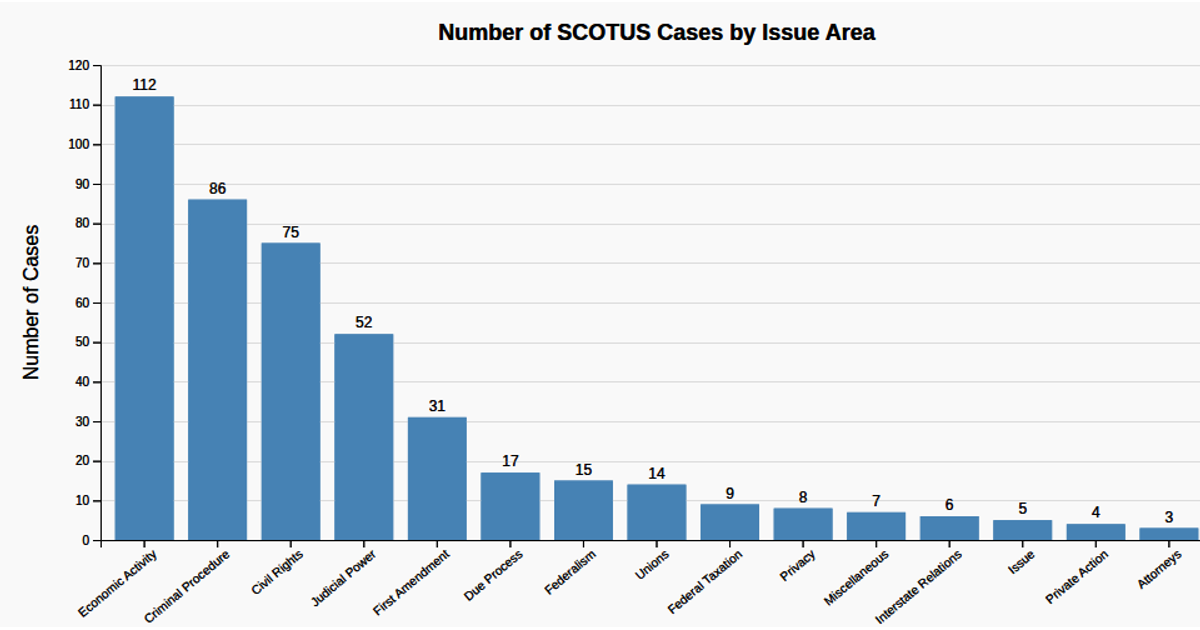
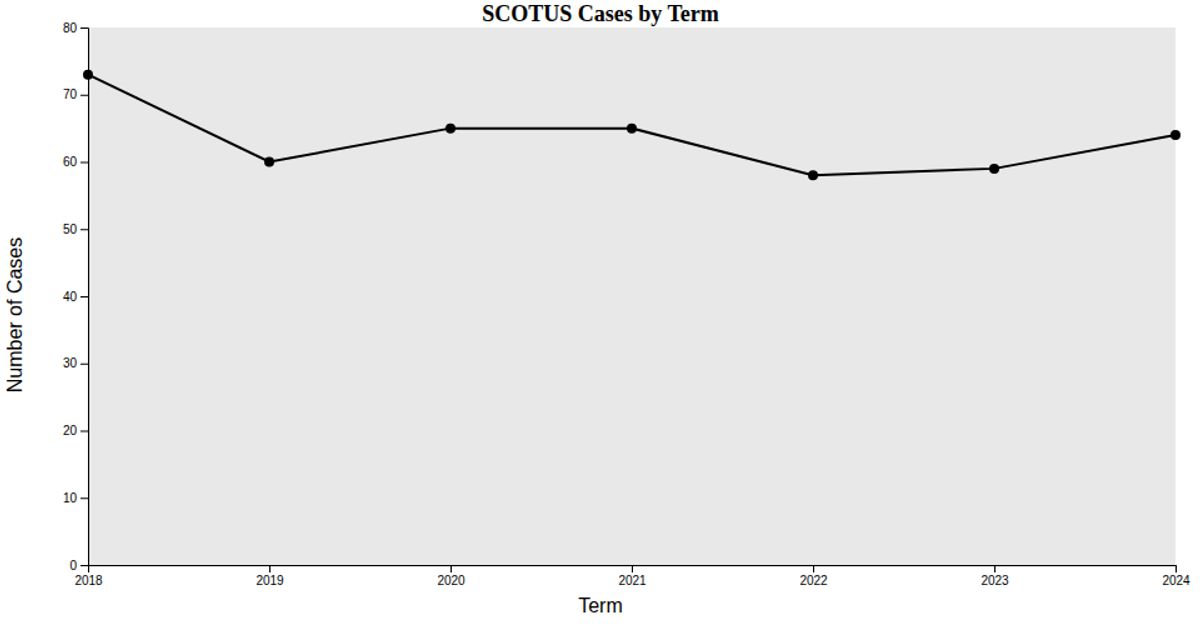
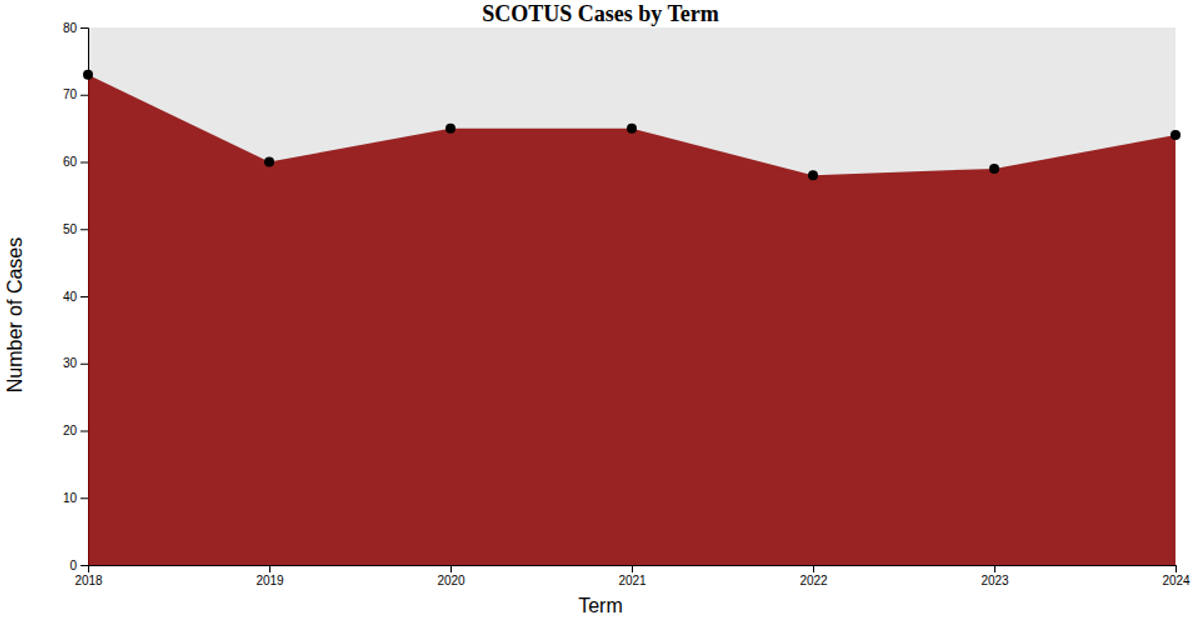
This example shows the number of Supreme Court cases from 2018 to 2024 grouped by issue area, with bars sorted in descending order and labeled with their counts. The chart is rendered as an SVG using D3 version 7, with scales built via `d3.scaleBand` and `d3.scaleLinear`. It loads the data from a remote CSV file using `d3.csv` and aggregates it with `d3.rollups`. The visualization includes hover effects on the bars, gridlines, axis labels, and a rotated x-axis for readability.
AI-generated descriptionMIT Licensed

Comments
Sign in to join the discussion.