🌍 Public
Activity 6_Task4_Likitha
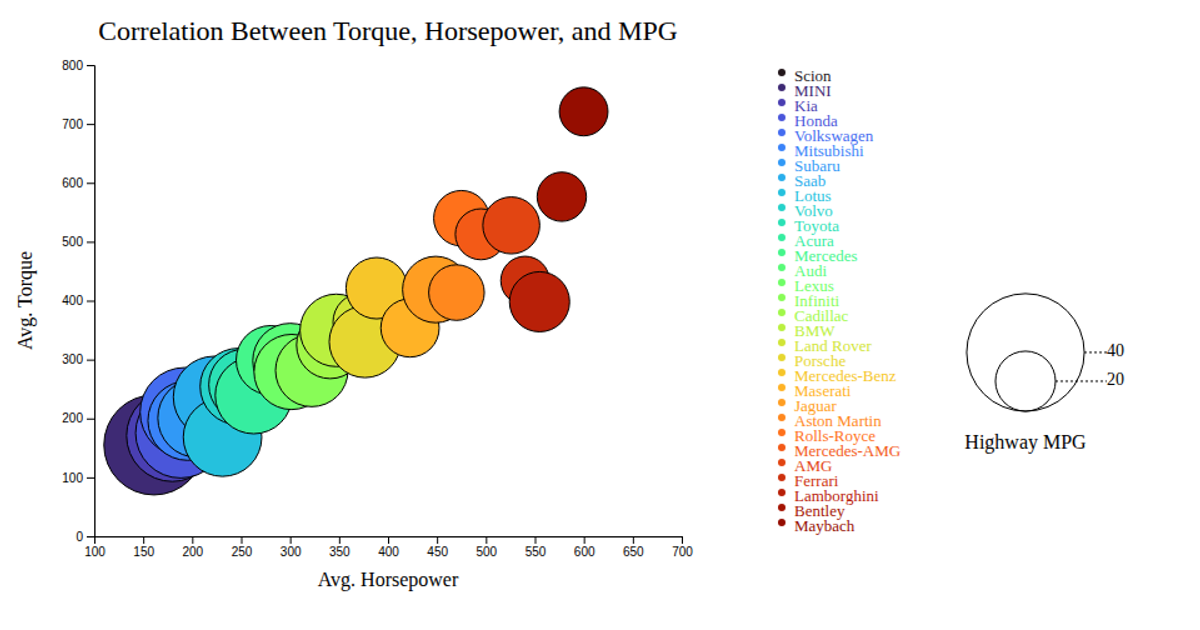
This bubble chart shows the relationship between average horsepower, torque, and highway fuel efficiency across different car makes, with each circle’s position encoding horsepower and torque while its size represents fuel efficiency. The visualization uses D3 v7 APIs including d3.scaleLinear, d3.scaleSqrt, d3.scaleOrdinal, and d3.schemeCategory10, rendering circles as SVG elements. Interactive tooltips appear on mouseover, displaying make, horsepower, torque, and MPG values. Data is loaded from a GitHub-hosted CSV file, with color coding by car brand and a legend showing selected manufacturers.
AI-generated descriptionMIT Licensed




Comments
Sign in to join the discussion.