🌍 Public
Fork of Fork of Vineela
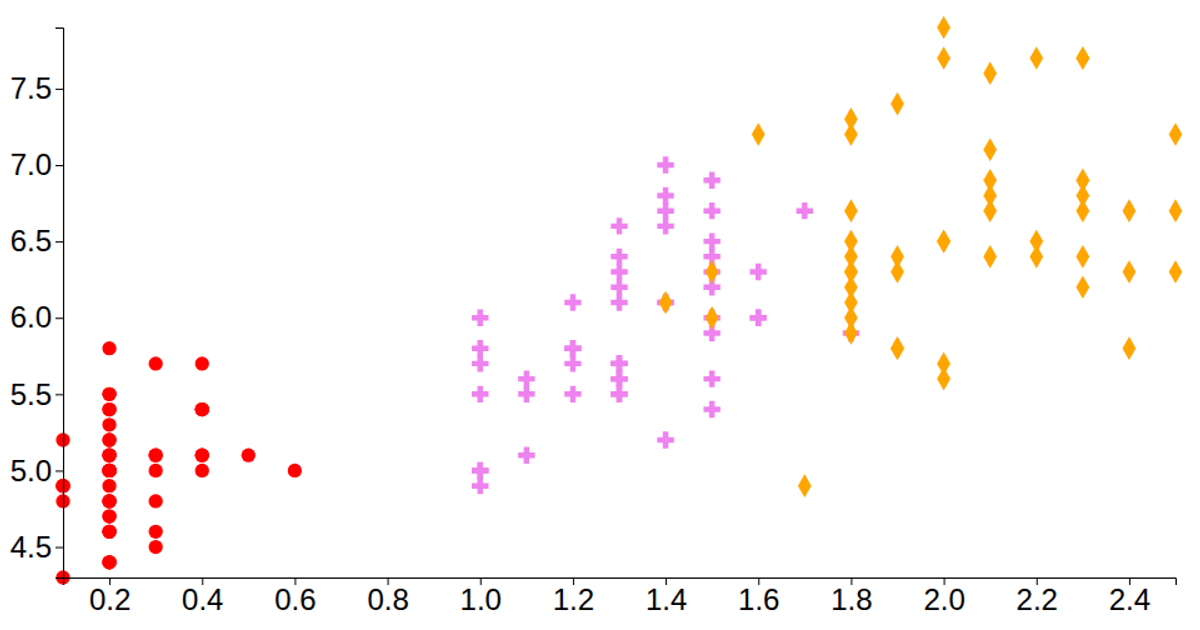
This scatter plot visualizes the Iris dataset, mapping petal width and sepal length along the axes. Each flower species—setosa, versicolor, and virginica—appears as a distinct colored symbol, with red, violet, and orange fills respectively. The visualization uses D3 v6 APIs including `scaleLinear`, `scaleOrdinal`, `axisLeft`, `axisBottom`, and `symbol` generators, rendering as SVG. Data loads from a CSV via `d3.csv`, and the code assigns colors through a custom `marker` function based on species.
AI-generated descriptionA vanilla HTML implementation of a D3 scatter plot. Shows the Iris Dataset.
MIT Licensed


Comments
Sign in to join the discussion.