🌍 Public
Line chart ICE 7 Saranya
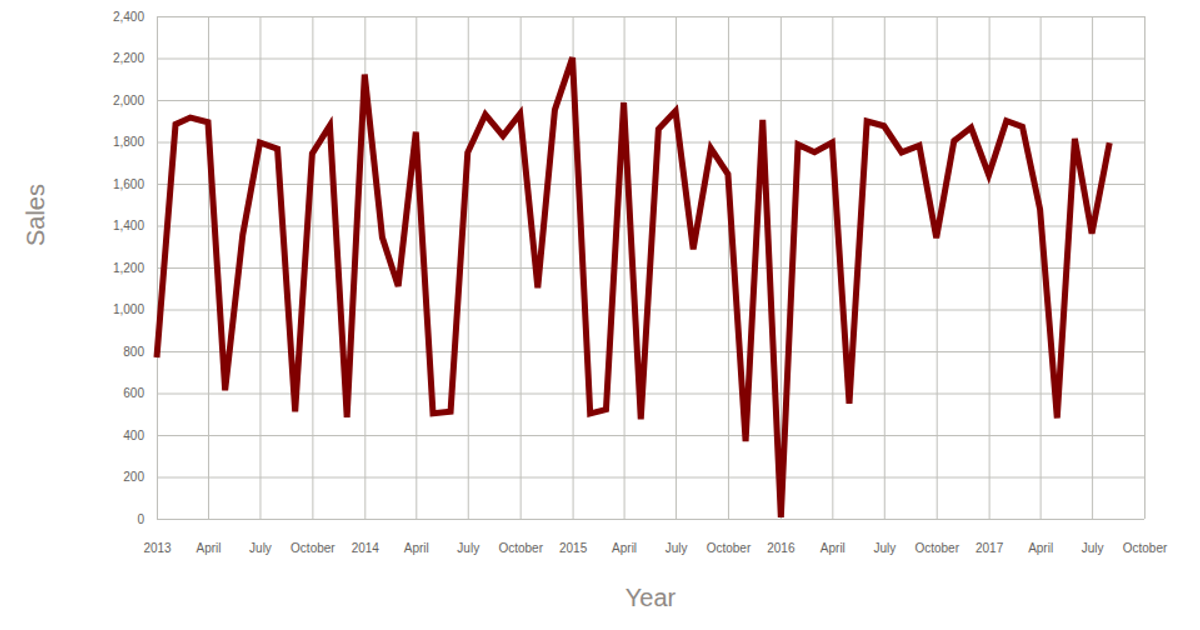
The line chart visualizes annual net forest conversion for seven South American countries, with each country’s trend line color-coded via a categorical scale. It uses D3 v5’s `d3.area` to render the paths, `d3.scaleTime` and `d3.scaleLinear` for the axes, and `d3.nest` to group the data by entity from a CSV file. Hovering over a line displays a tooltip with the entity name, while the chart title and legend are drawn as SVG text elements.
AI-generated descriptionMIT Licensed




Comments
Sign in to join the discussion.