🌍 Public
Basilicata School Dashboard
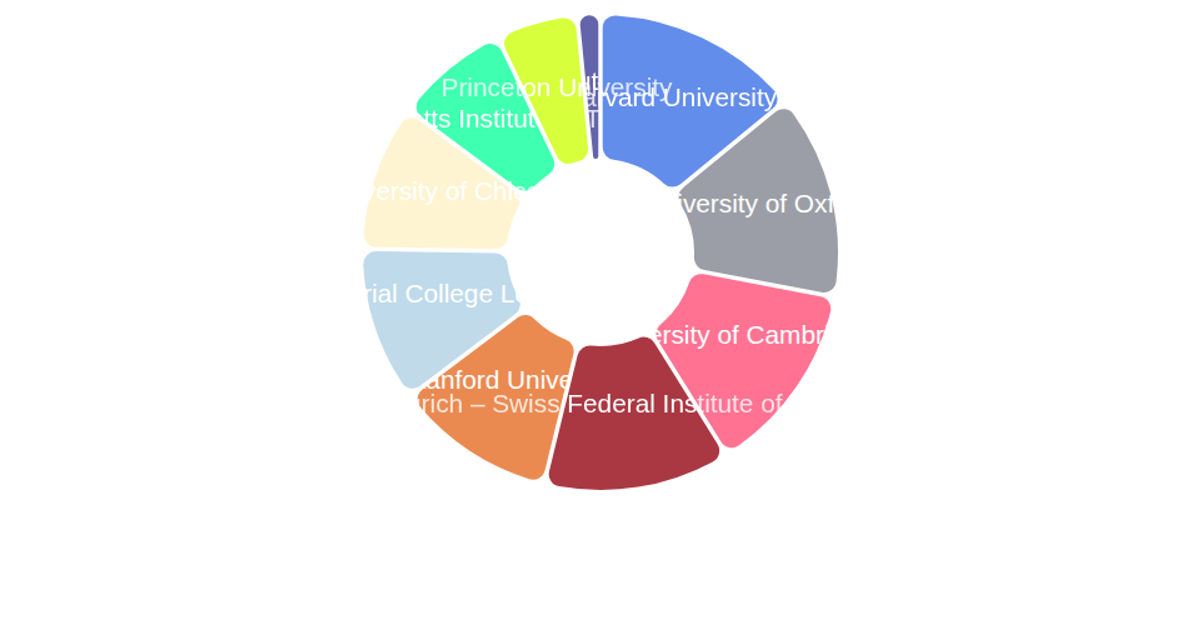
This dashboard visualizes Basilicata school statistics across multiple dimensions, allowing exploration of student populations and class counts by location, grade level, and year. An SVG map colors regions by selected grade and uses opacity to encode population size, while donut charts show grade distributions and a line chart displays population trends over time. The dashboard uses D3 v5 modules including `scaleOrdinal`, `nest`, `pie`, `arc`, `line`, and `scaleTime`, with dropdown menus and a fixed control panel for filtering. Data is loaded from a JSON dataset and processed to compute regional and cross-grade aggregates.
AI-generated descriptionMIT Licensed





Comments
Sign in to join the discussion.