🌍 Public
ice82
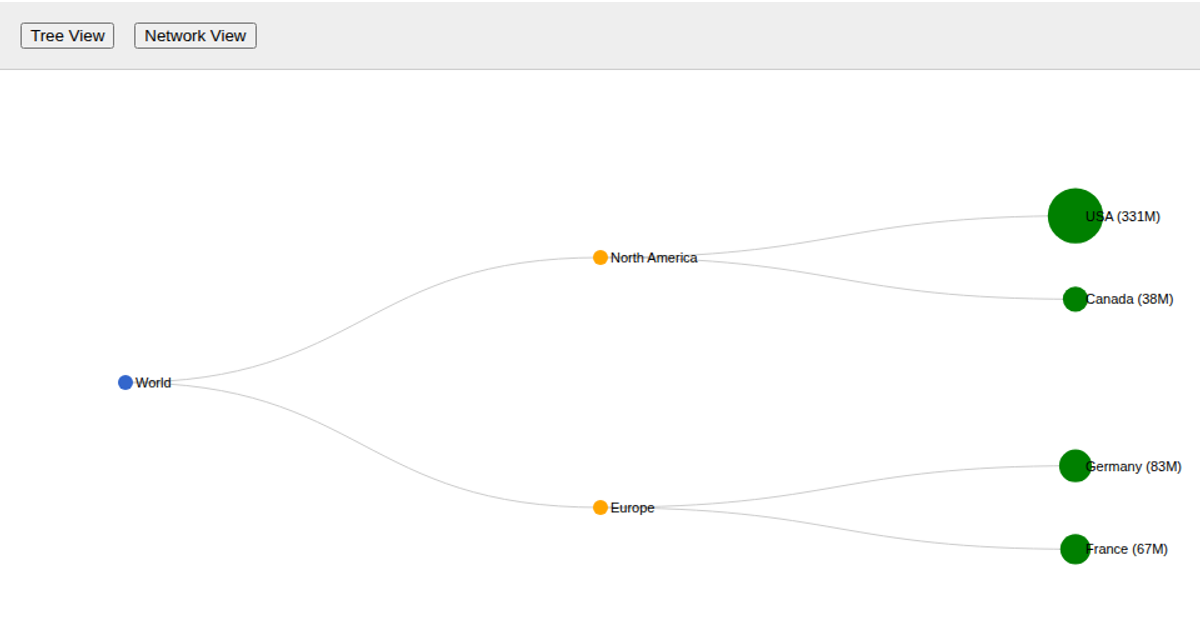
This example presents hierarchical population data as an interactive tree and network visualization. Buttons toggle between a `d3.tree` layout showing parent-child relationships with node sizes scaled by population, and a `d3.forceSimulation` network view with draggable nodes and link lines. The code uses D3 v7 with SVG rendering, drawing colored circles and labels for world regions and countries from embedded sample data.
AI-generated descriptionMIT Licensed




Comments
Sign in to join the discussion.