🌍 Public
Fork of ICE-5: CSV Data with D3.js
BBajiSharifPatan@my.unt.edu
Last edited Feb 28, 2022
Created on Feb 27, 2022
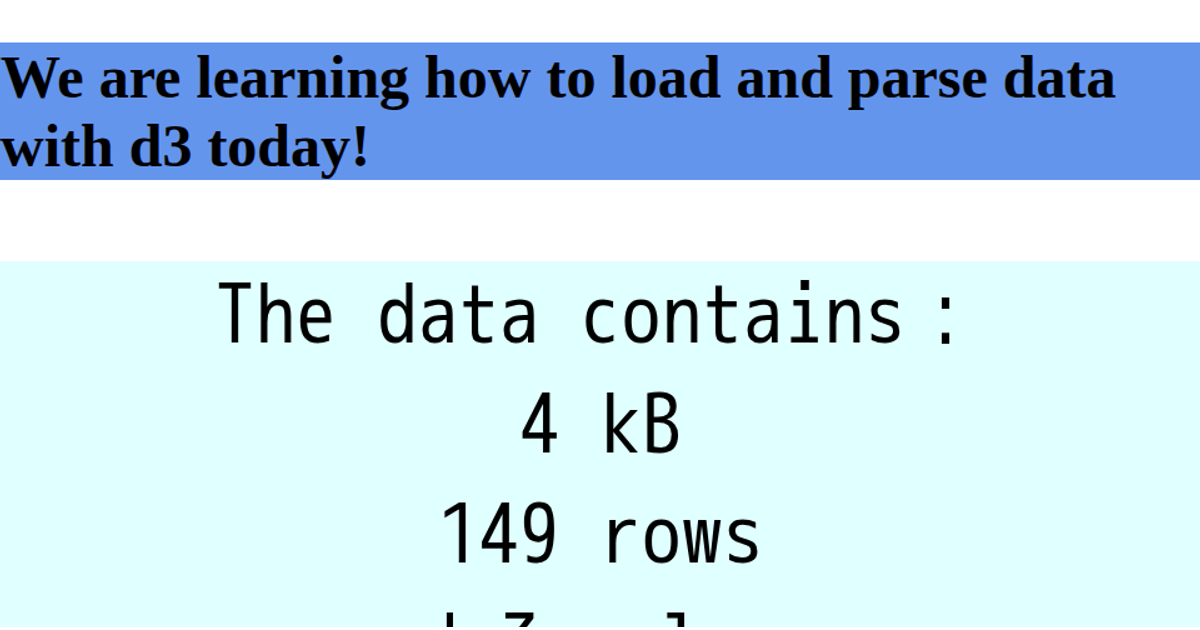
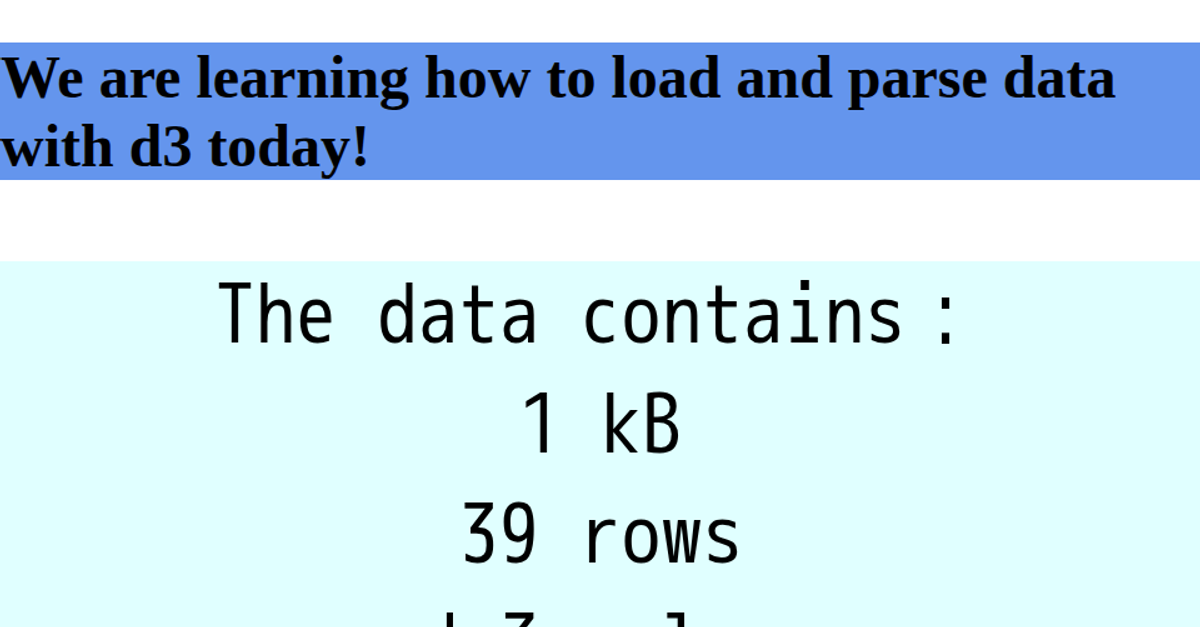
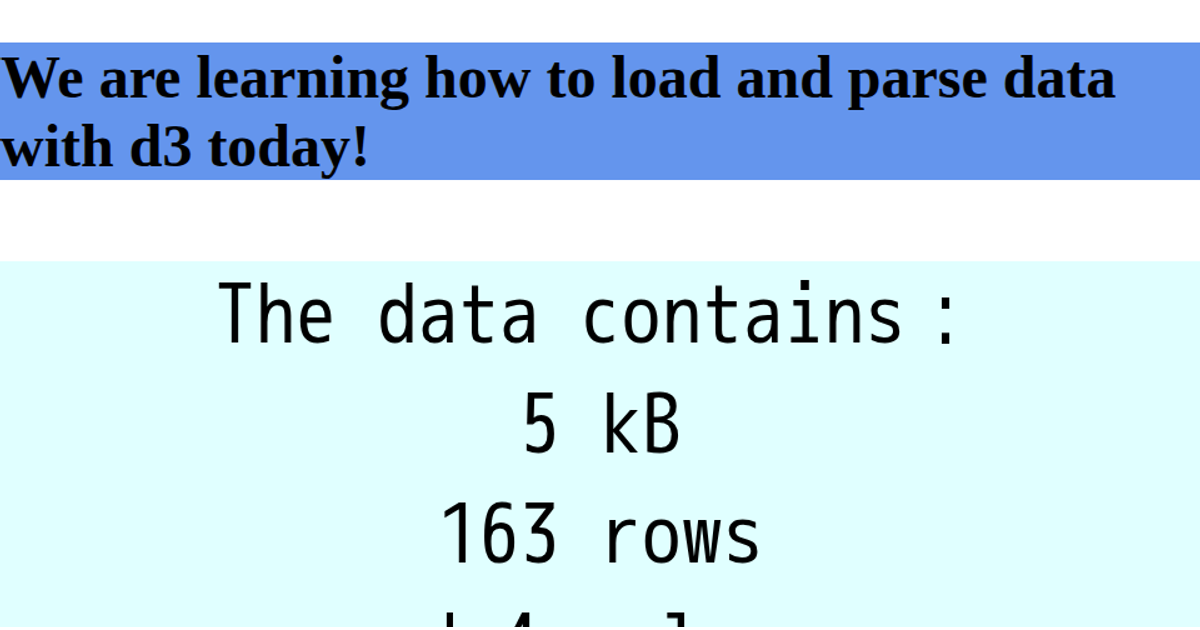
This example demonstrates how to load and parse a CSV dataset using D3.js. The visualization displays a summary of the data, including its size in kilobytes, the number of rows, and the number of columns, within a styled HTML page. The code fetches a remote CSV file using the `d3.csv` method and formats the parsed data with `d3.csvFormat` to calculate the file size. The result is rendered as text into a `<pre>` element, alongside a static SVG image of a panda. The page styling is handled with basic CSS.
AI-generated descriptionA bare minimum HTML page demonstrating use of CSS and JavaScript.
See also React Starter.
MIT Licensed





Comments
Sign in to join the discussion.