🌍 Public
5_Customization of Axes
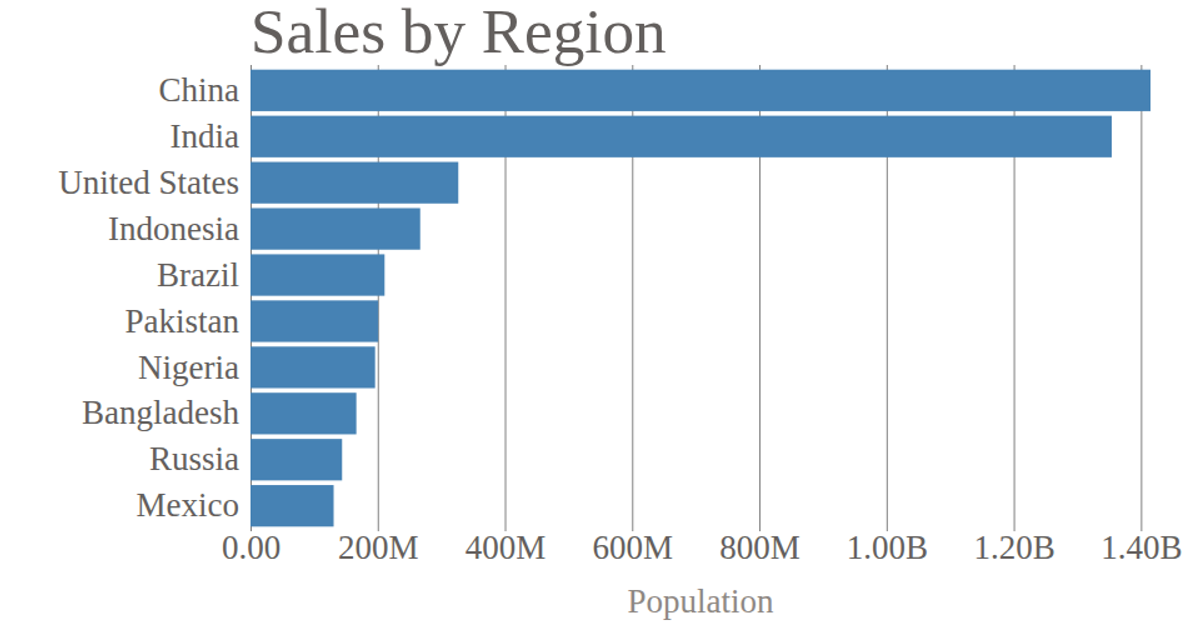
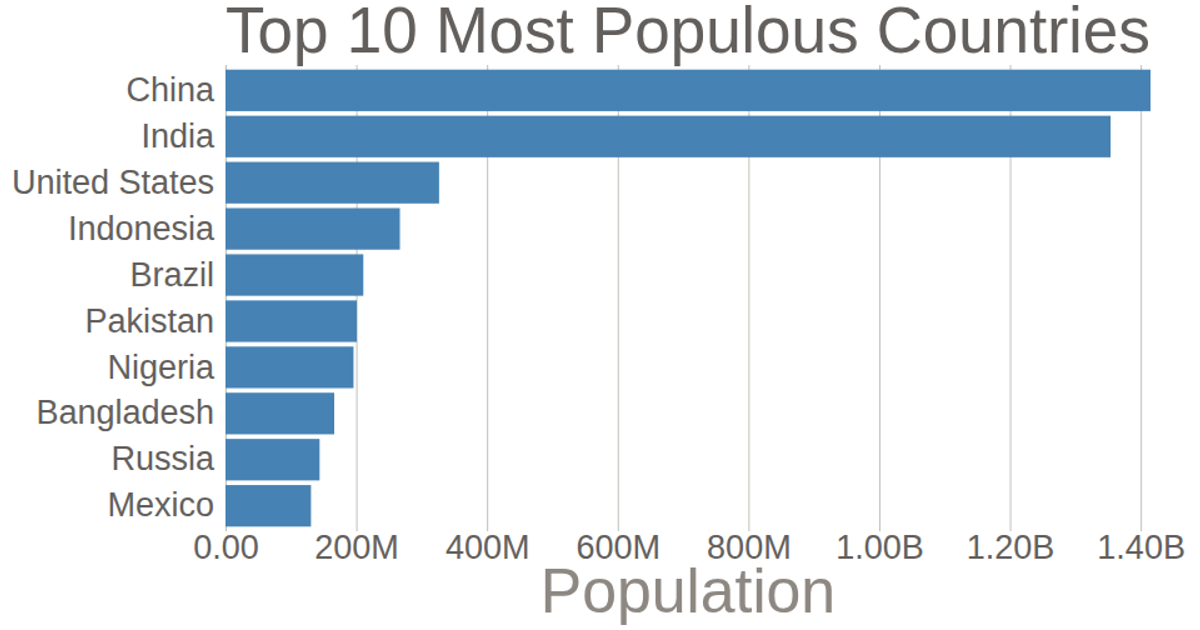
A horizontal bar chart displays the population of the top 10 most populated countries, using data from the United Nations. The chart customizes both axes: the y-axis removes tick lines and the domain, while the x-axis formats population values in billions and adds gridlines. Built with D3 v5, it uses `scaleLinear`, `scaleBand`, `axisBottom`, and `axisLeft` to render SVG elements.
AI-generated descriptionThis bar chart shows population of the top 10 most populated countries. link United Nation
MIT Licensed




Comments
Sign in to join the discussion.