🌍 Public
hbc + codegap + heading
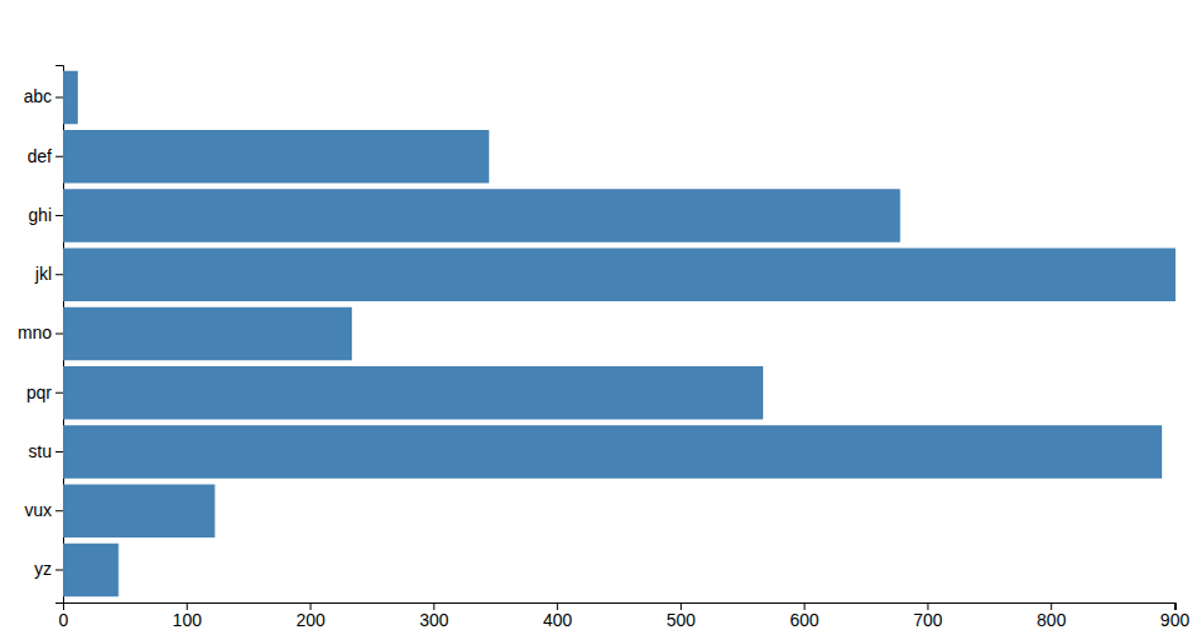
This example displays a horizontal bar chart of letters from 'a' to 'm' against their corresponding numeric values, using a green fill for each bar with an overall title. The visualization loads data from a CSV file and renders with D3 v5, using `d3.csv`, `scaleLinear` for the x-axis, `scaleBand` for the categorical y-axis, and `axisLeft` and `axisBottom` to draw the axes. Bars are generated through a data join, with height determined by the band scale's bandwidth and width scaled to each value.
AI-generated descriptionMIT Licensed




Comments
Sign in to join the discussion.