🌍 Public
Monoliths on a Globe
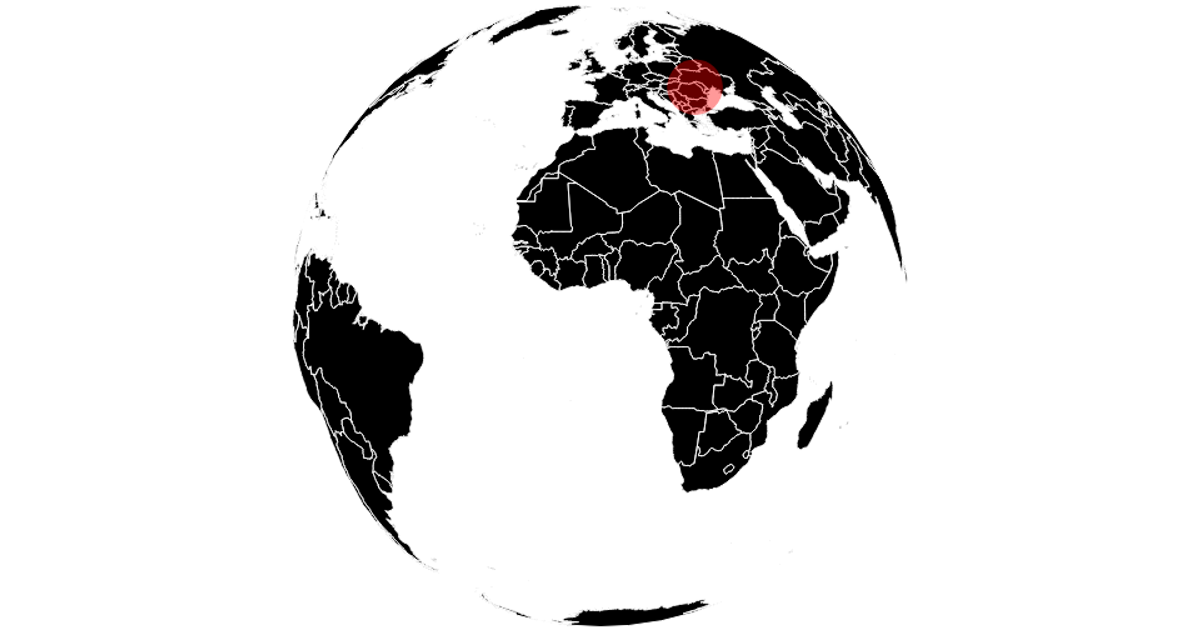
This visualization displays three monolith locations—Utah, Romania, and California—as red circles on an interactive orthographic globe, with circle size and tooltip (via d3-tip) representing population. Users drag to rotate the globe using d3.drag and zoom with d3.zoom, which adjust the d3.geoOrthographic projection. The code renders country boundaries with d3.geoPath from TopoJSON world-atlas data, switching between 110m and 50m resolutions during interaction for performance. Data comes from a local CSV file.
AI-generated descriptionMIT Licensed


Comments
Sign in to join the discussion.