🌍 Public
Untitled
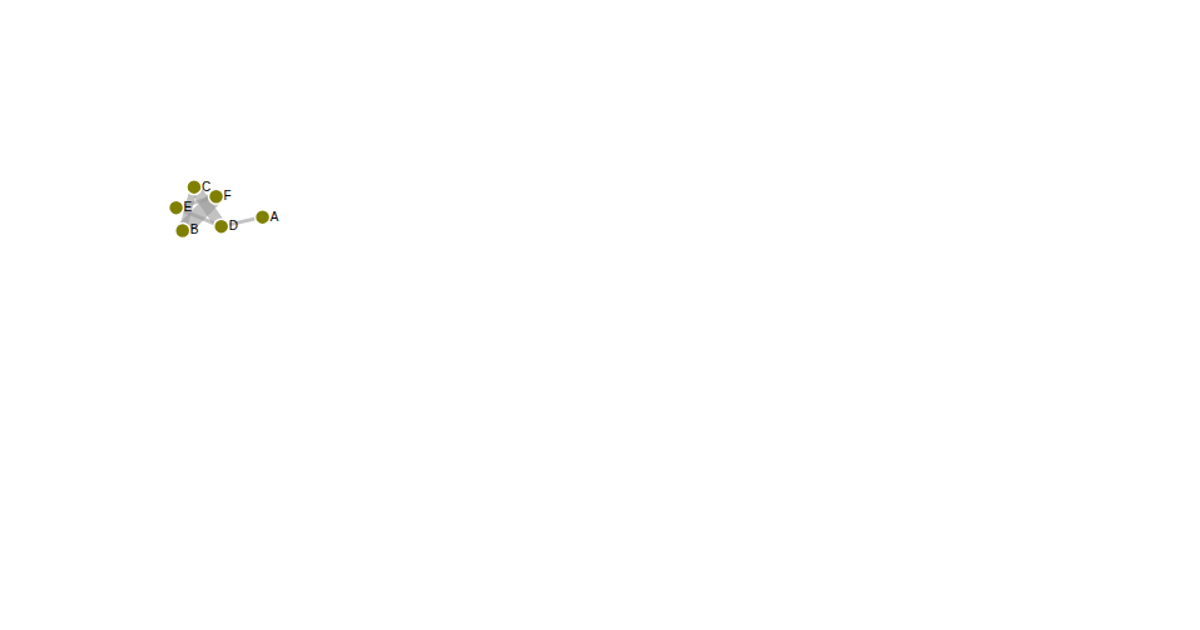
This example shows a small network of seven labeled nodes and eight edges arranged using constraint-based layout from the WebCola library. The graph loads from a JSON file, with each node having fixed dimensions and links defined by source/target indices. The visualization uses a force-directed approach to position the interconnected nodes while maintaining readability. The page is built with React and styled with minimal CSS, hiding margins and overflow for a clean, full-window display.
AI-generated descriptionA bare minimum WebCola page.
See also React Starter.
MIT Licensed






Comments
Sign in to join the discussion.