🌍 Public
AggregatedDeaths
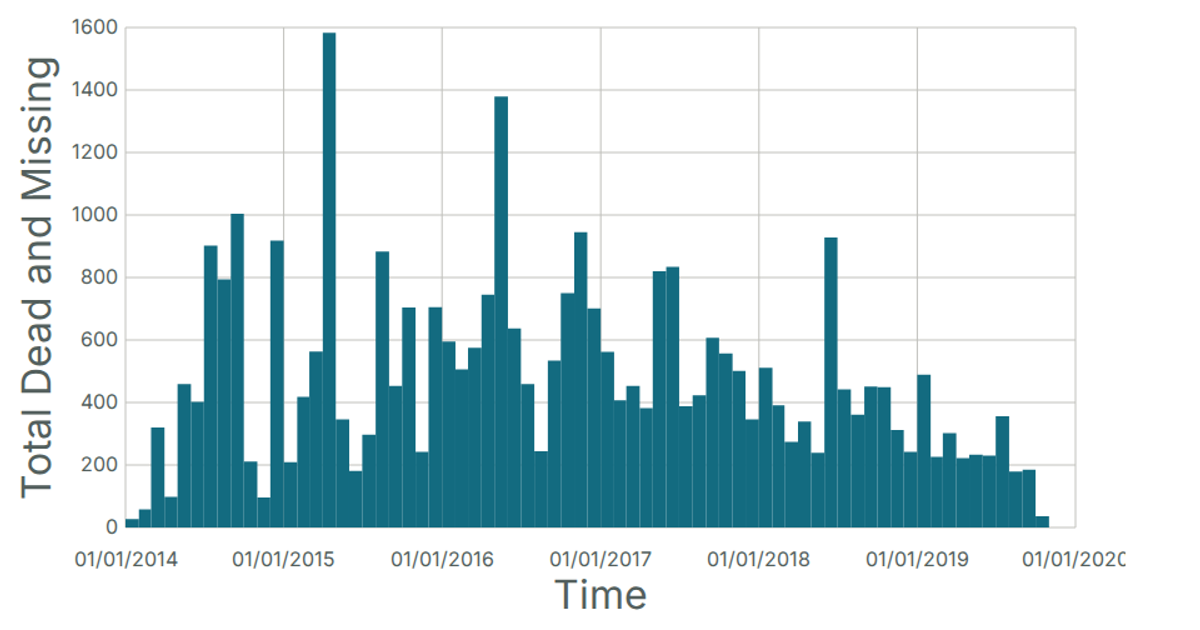
This chart visualizes the total number of dead and missing migrants each month, aggregating the data into a date histogram. The y-axis displays the average age of death per month, while the x-axis shows time. The visualization uses React and D3 v5, specifically leveraging `d3.bin` to group the data into monthly bins and `d3.mean` to calculate the average age. The chart is rendered as an SVG and pulls data from a CSV file hosted in a GitHub gist.
AI-generated descriptionA date histogram showing the sum total dead and missing migrants for each month.
Data from the Missing Migrants Dataset.
MIT Licensed




Comments
Sign in to join the discussion.