🌍 Public
activity8_task4
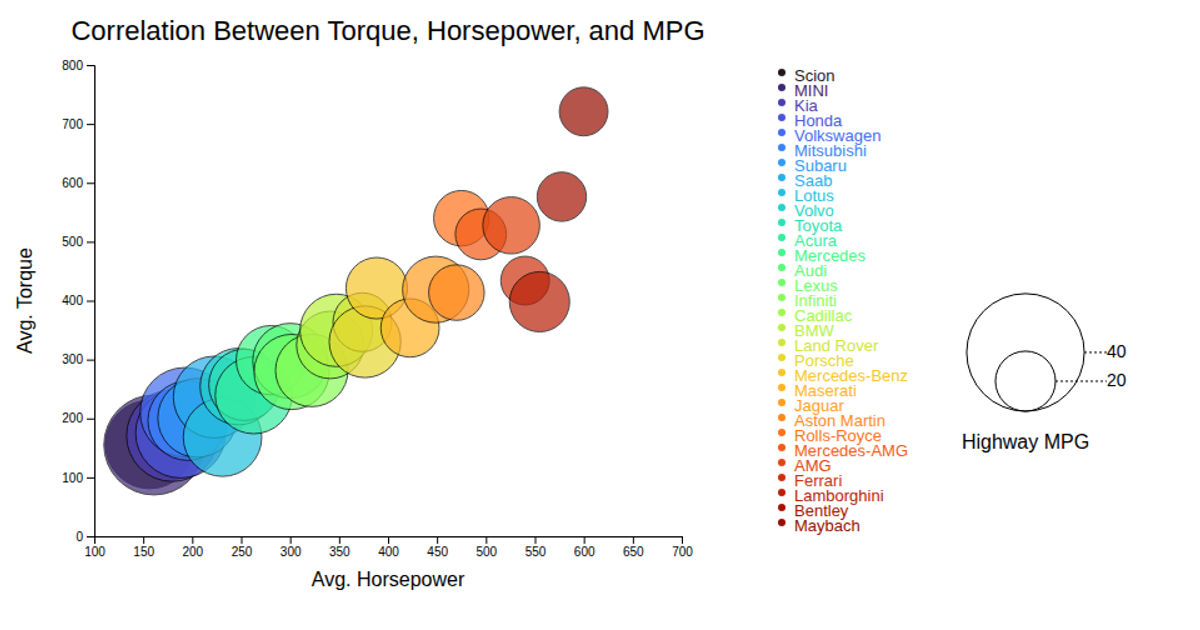
This bubble chart visualizes the correlation between average horsepower, torque, and highway MPG across fictional car makes. Each circle’s position maps horsepower and torque on the x- and y-axes, while its radius encodes highway MPG and its color distinguishes the car make. Built with d3.v7 and SVG, the chart includes an interactive tooltip on mouseover, plus legends for bubble size and color categories. Animations and hover effects are handled through D3 event listeners and CSS transitions.
AI-generated descriptionMIT Licensed


Comments
Sign in to join the discussion.