🌍 Public
Fork of barGraph TD1 correction
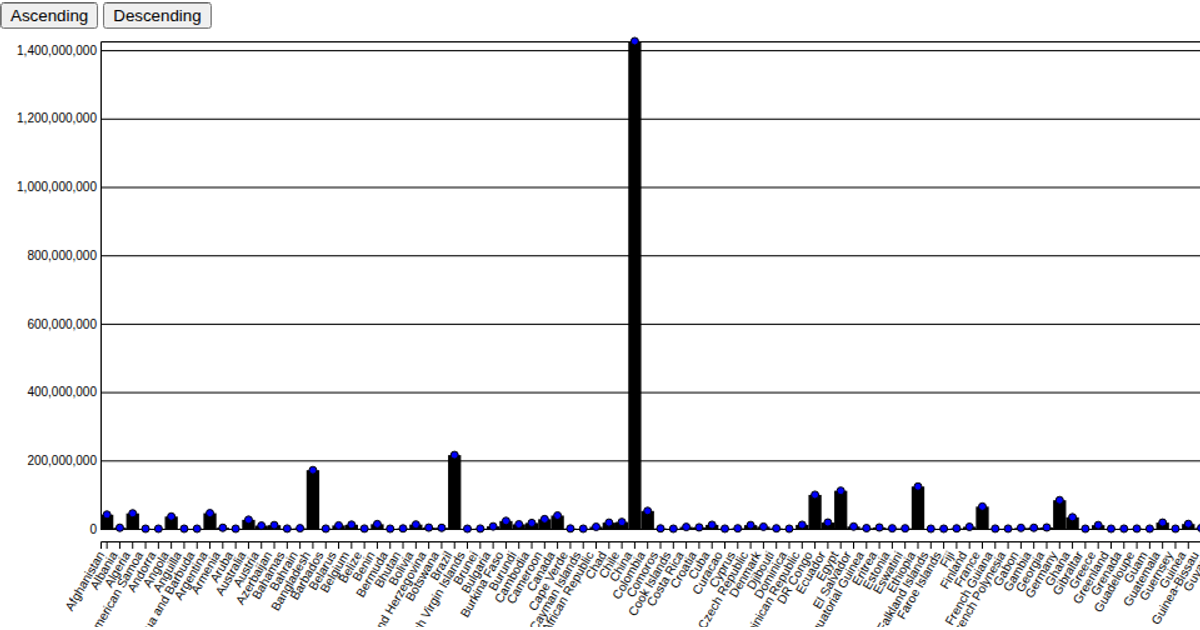
This visualization shows global population rankings for 2022 using a bar chart and scatter plot overlay, with buttons to reorder the data by ascending or descending population. It uses D3 v5 to load a CSV file and render SVG elements, with transitions animating the bars and circles when the sort order changes. The code relies on d3.scaleBand, d3.scaleLinear, axis generators, and rect/circle selections, while a styled tooltip appears on mouseover via the div.tooltip element.
AI-generated descriptionMIT Licensed


Comments
Sign in to join the discussion.