🌍 Public
abi_2
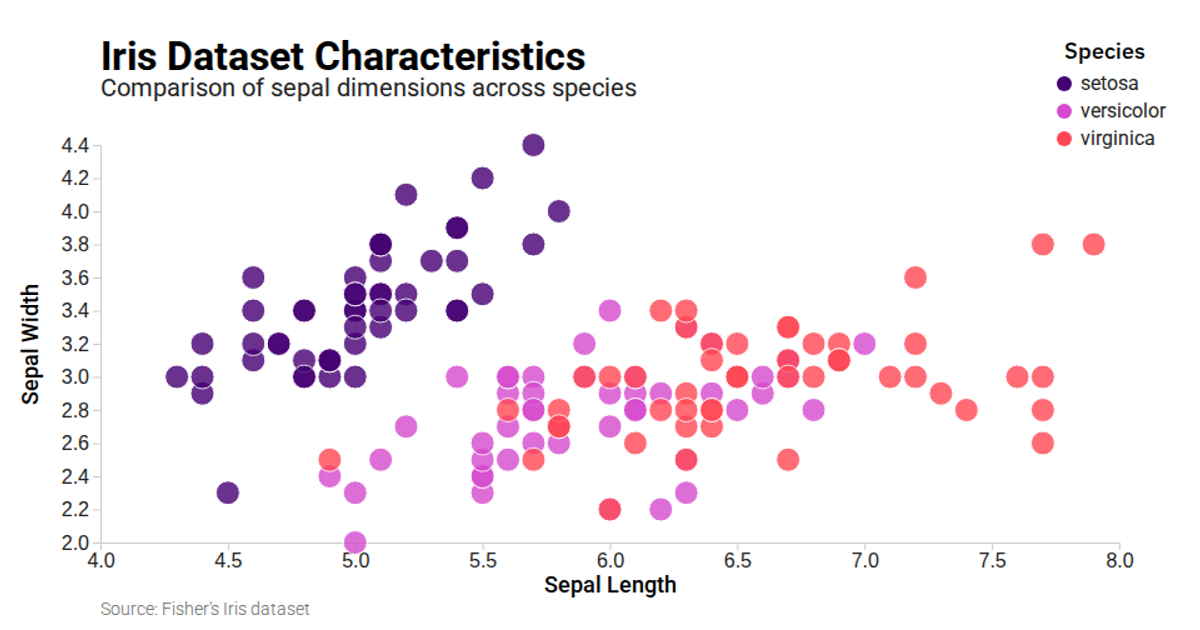
This interactive scatter plot compares sepal length and sepal width across three Iris species, with a legend that supports highlighting by fading non-hovered categories via hover events. It loads data asynchronously through D3’s `csv` parser and renders the visualization using D3 selections and scale functions like `scaleLinear` and `scaleOrdinal`. The chart includes axes, labels, and a clickable legend built with D3’s data-join pattern, while the code also uses `ResizeObserver` for responsive container tracking. Data comes from Fisher’s Iris dataset, and the points are styled using the BBC purple color theme.
AI-generated descriptionMIT Licensed






Comments
Sign in to join the discussion.