🌍 Public
Activity6_task4_question
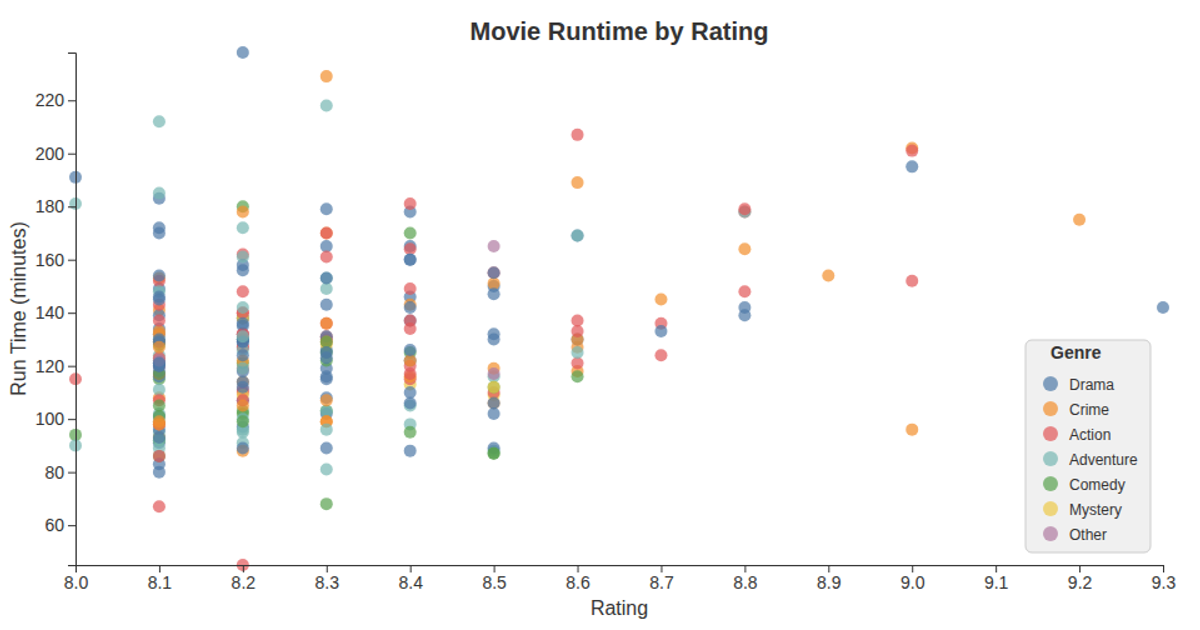
This bubble chart visualizes movie runtime trends over time for top-rated films from IMDb, with each circle’s radius scaled by rating and color-coded by simplified genre. The D3 v7 visualization uses `scaleLinear` for year, runtime, and radius scales, plus `scaleOrdinal` with `schemeSet2` for genre colors. Data preprocessing splits multi-genre entries into top seven genres via `preprocessGenres`, while `parseRuntime` converts duration strings to minutes. An interactive legend allows highlighting specific genre bubbles through mouseover events and click-based filtering.
AI-generated descriptionMIT Licensed



Comments
Sign in to join the discussion.