🌍 Public
Activity - 6_Task-3.1
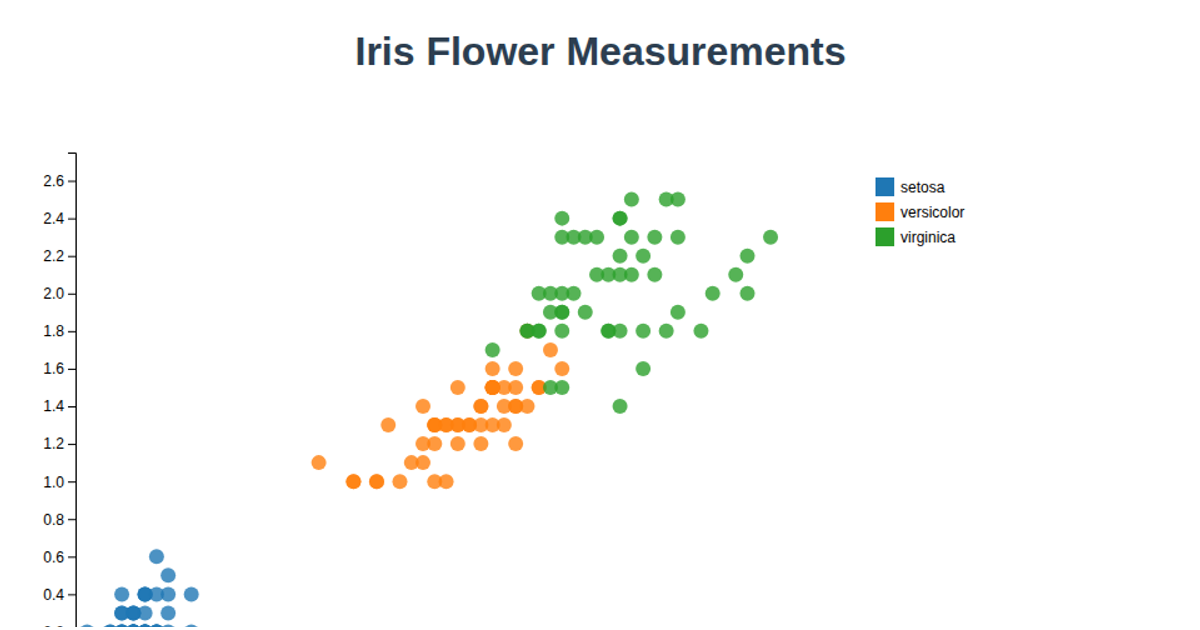
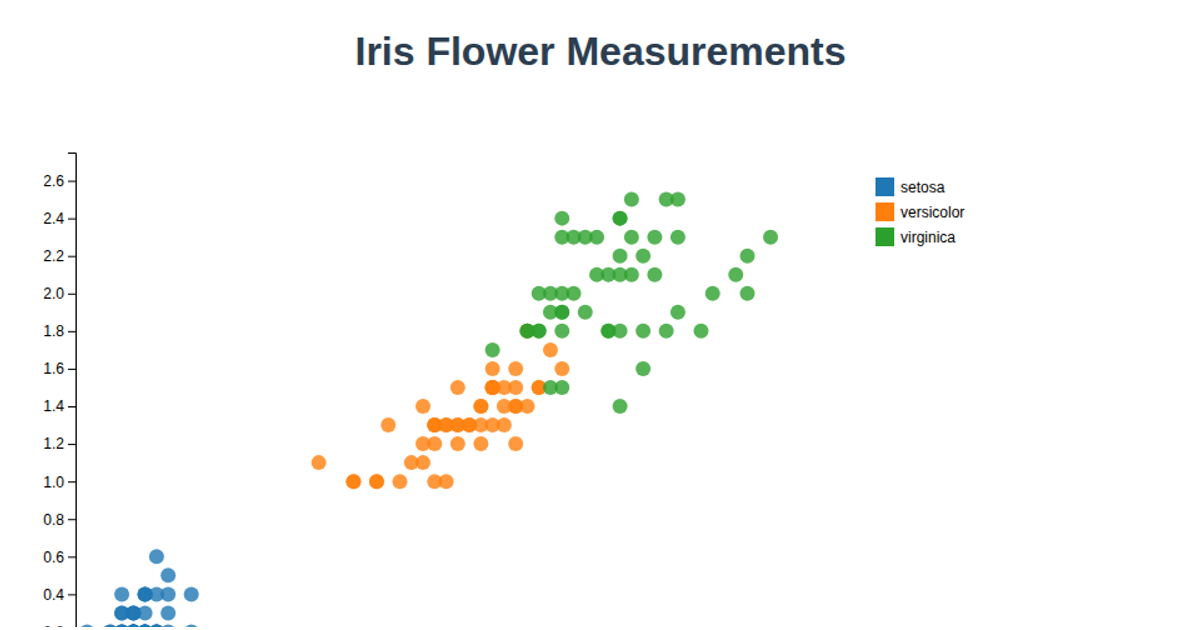
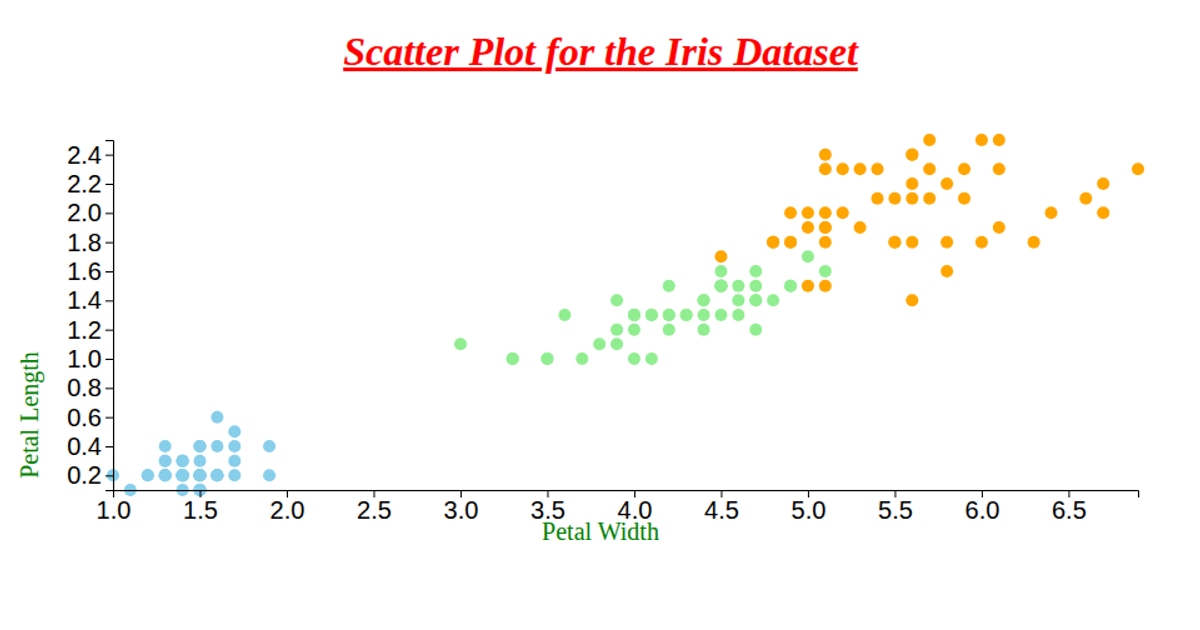
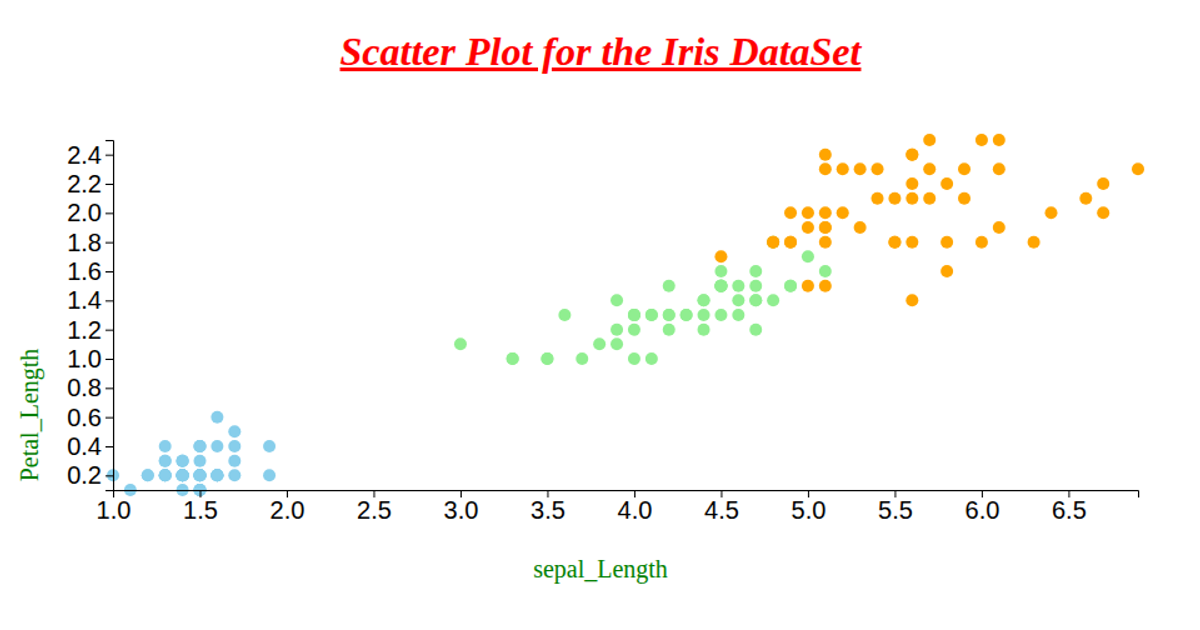
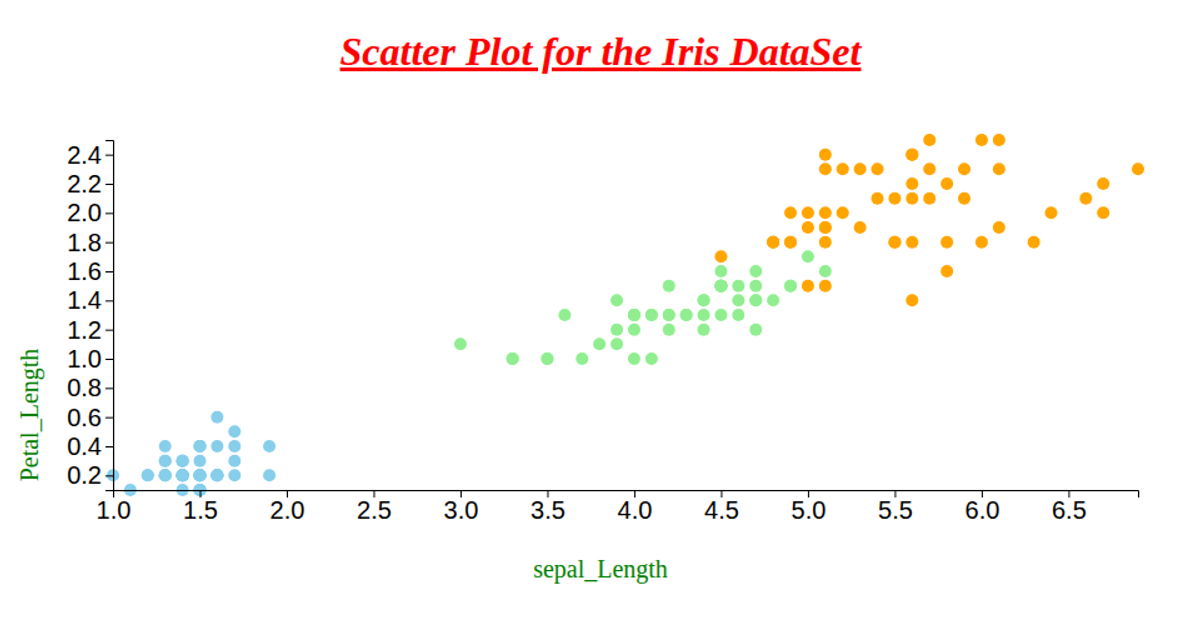
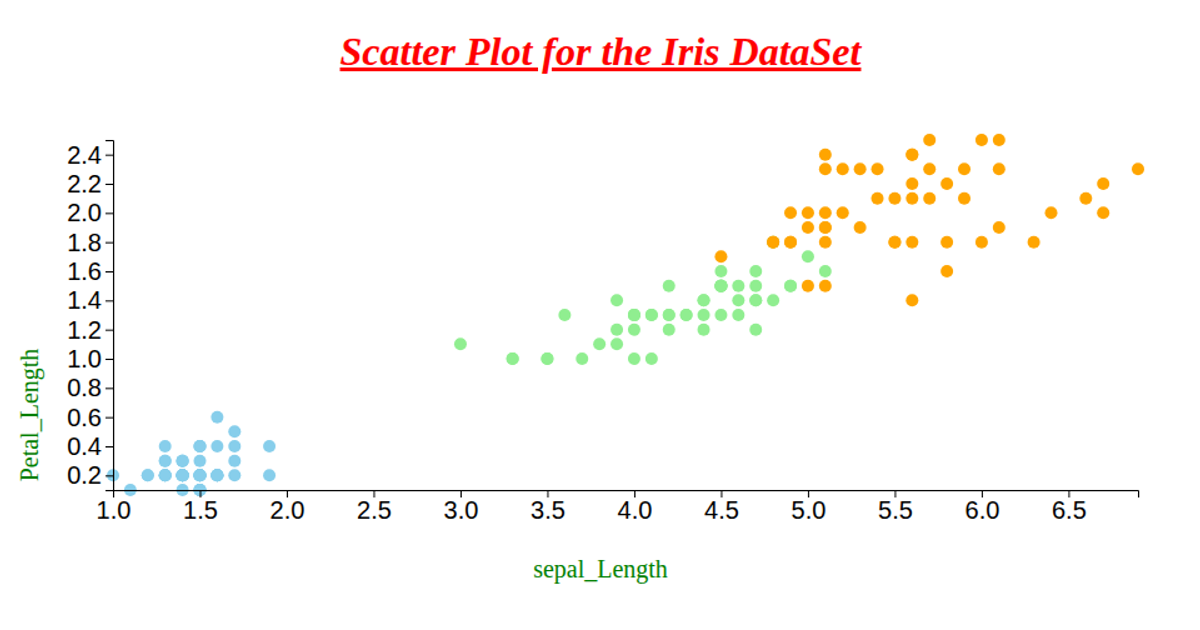
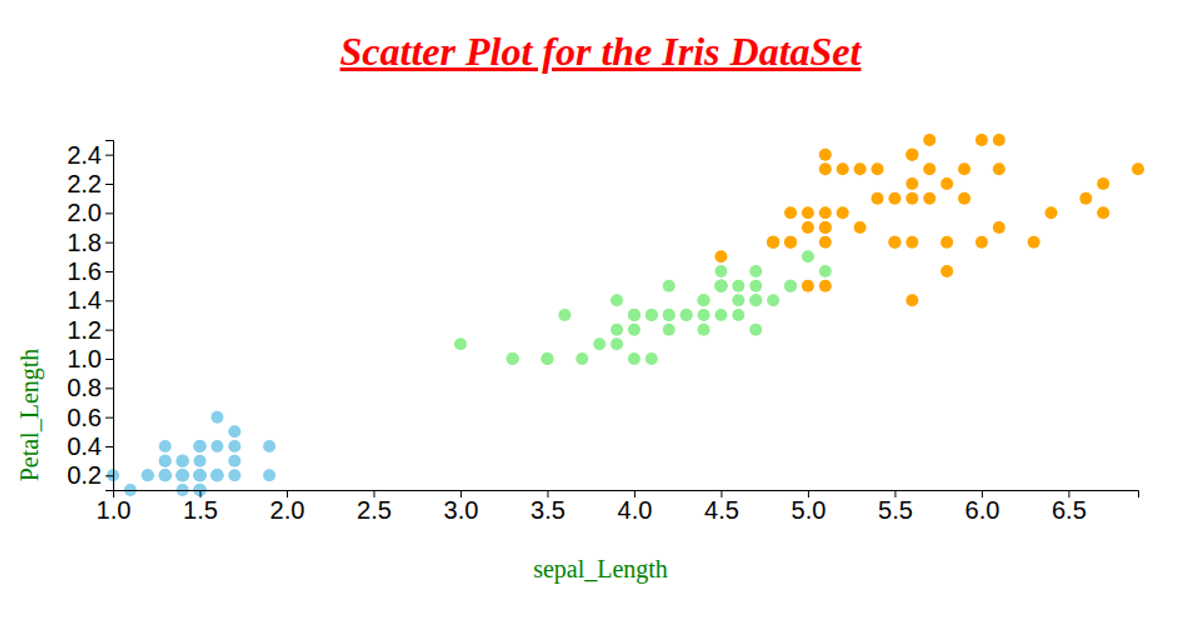
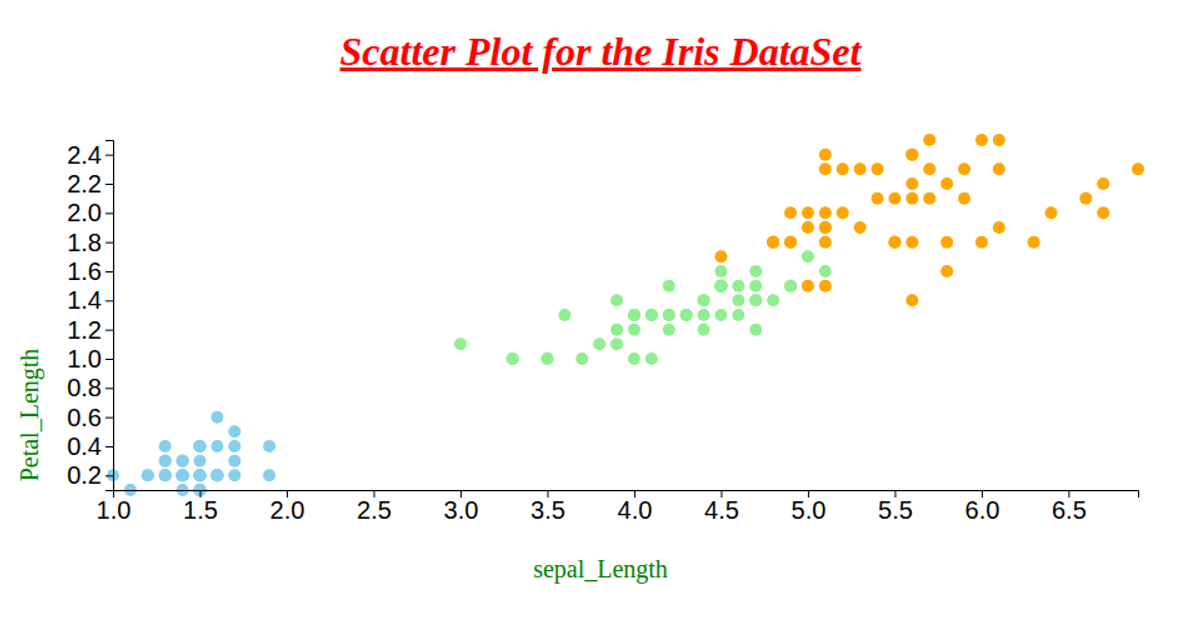
This interactive scatter plot visualizes the Iris dataset, showing the relationship between petal length and petal width for three iris species. The visualization uses D3.js v7 to load CSV data from a GitHub source, then maps the measurements to SVG circles, with each species assigned a distinct color. Hovering over a point enlarges it and displays a tooltip with the exact measurements and species name. The chart includes labeled axes and a color-coded legend, all rendered as scalable vector graphics with an animated transition effect for the tooltip opacity.
AI-generated descriptionMIT Licensed
Comments
Sign in to join the discussion.