🌍 Public
practice
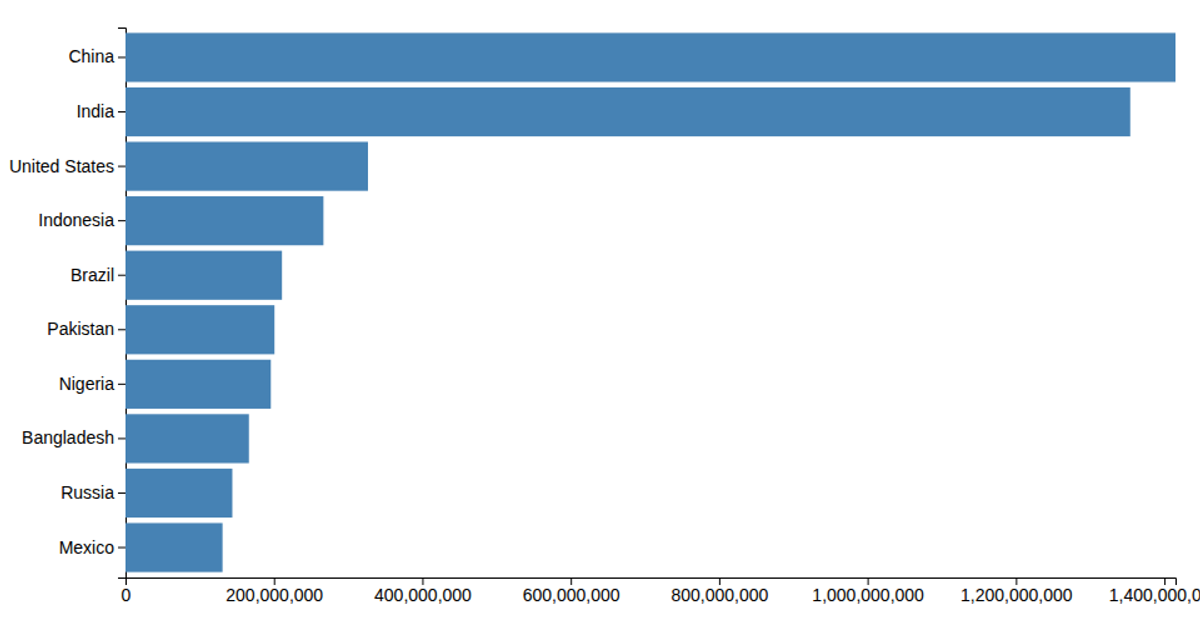
This bar chart shows the populations of the ten most populous countries using 2018 estimates from the UN World Population Prospects. The visualization uses D3 v6 with an SVG rendering, where each country is represented by a rectangle scaled along a linear population axis and positioned with a band scale. The data is loaded from a CSV file via `d3.csv`, and axes are generated with `axisLeft` and `axisBottom`. The chart also includes console output from an asynchronous promise example, though it does not affect the visual display.
AI-generated descriptionThis bar chart shows population of the top 10 most populous countries. The data comes from the year 2018 estimate in World Population Prospects 2017.
MIT Licensed


Comments
Sign in to join the discussion.