🌍 Public
Delitos por provincia en Costa Rica
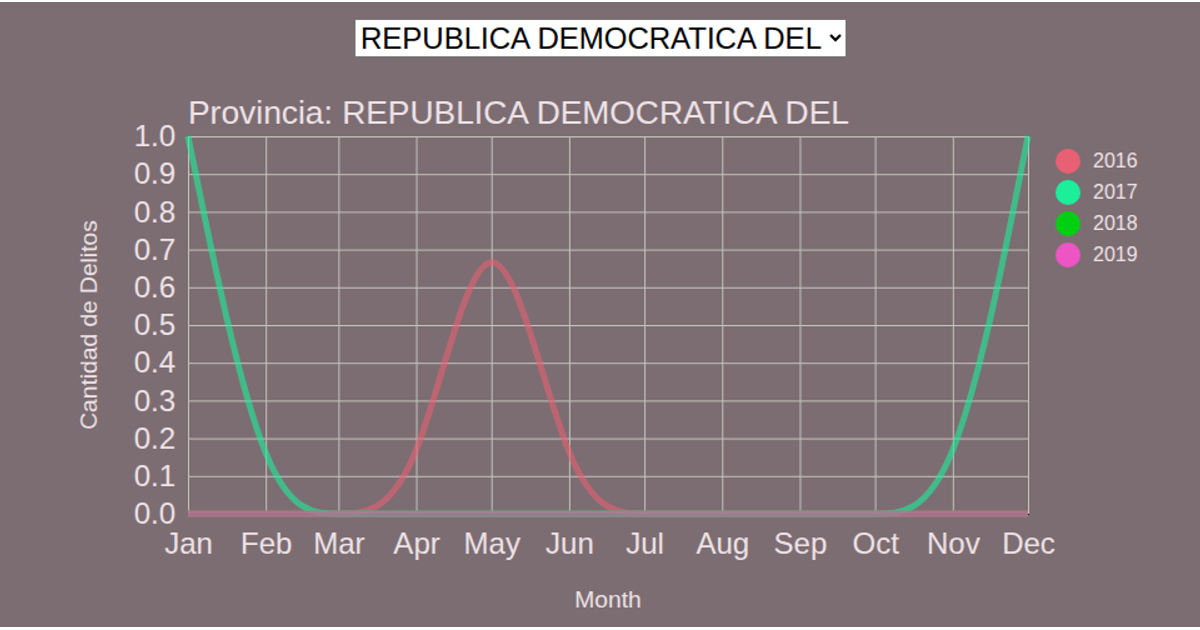
This example uses a line chart and dropdown menu to compare monthly crime counts across Costa Rican provinces from 2016 to 2019. The chart displays a selected province’s crime data over time, with separate lines for each year colored via a categorical scale. Users select a province from the dropdown, triggering a smooth 1.5-second transition of the line paths. It uses d3.csv for data loading, d3.scaleTime, d3.scaleLinear, d3.axisBottom, d3.axisLeft, d3.line with curveBasis, and d3.nest to group data by year, all rendered as SVG with CSS styling.
AI-generated descriptionMIT Licensed




Comments
Sign in to join the discussion.