🌍 Public
Vinay world map
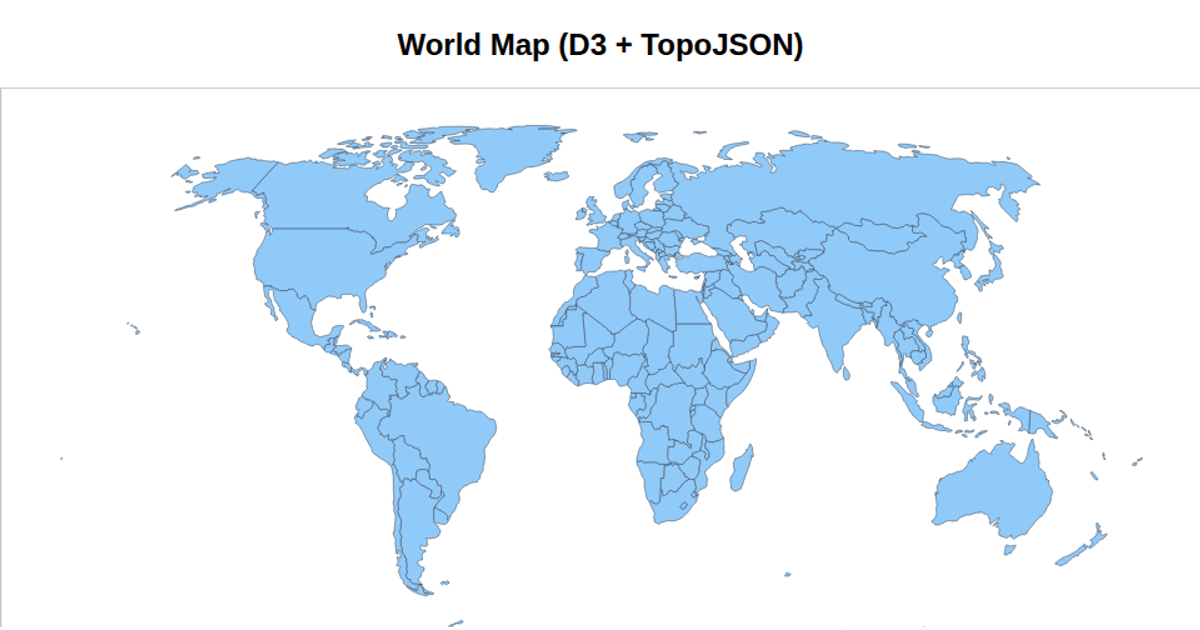
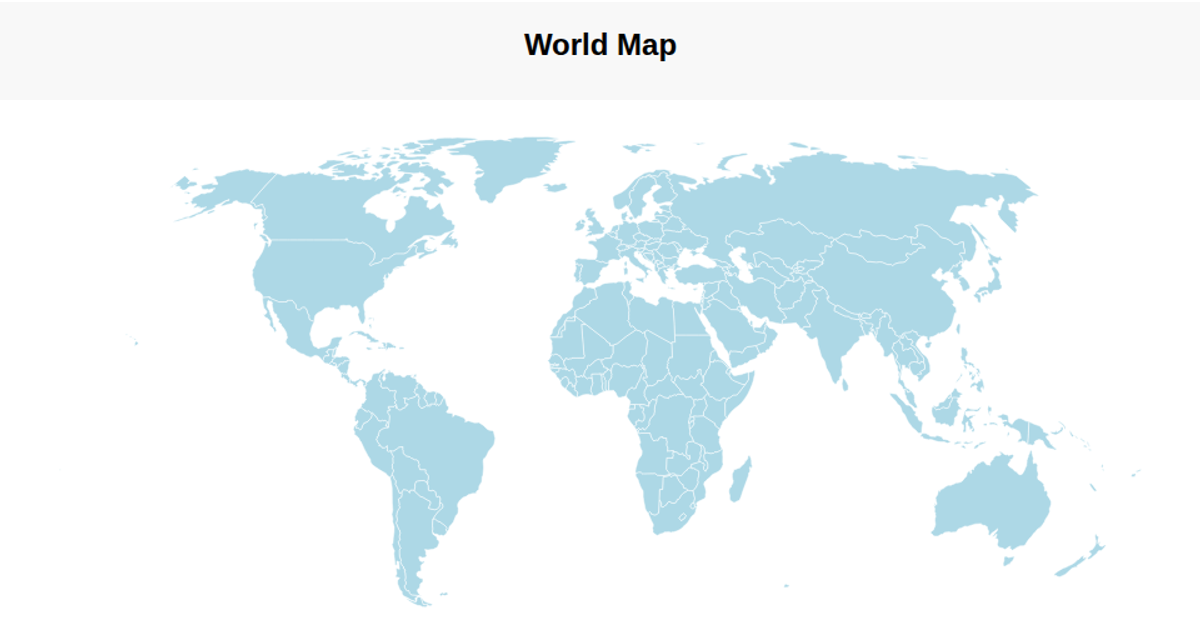
This example displays a world map using a Natural Earth projection, with each country filled in varying shades of blue. The visualization shows geographic boundaries, a graticule, and a sphere background, drawn as SVG paths via `d3.geoPath`. It loads TopoJSON country data from the world-atlas package and converts it to GeoJSON with `topojson.feature`, applying a color scale based on data index. The map is built with D3 v7, using `d3.geoNaturalEarth1` for the projection and `d3.geoGraticule` for the grid lines.
AI-generated descriptionMIT Licensed




Comments
Sign in to join the discussion.