🌍 Public
Dot Density India
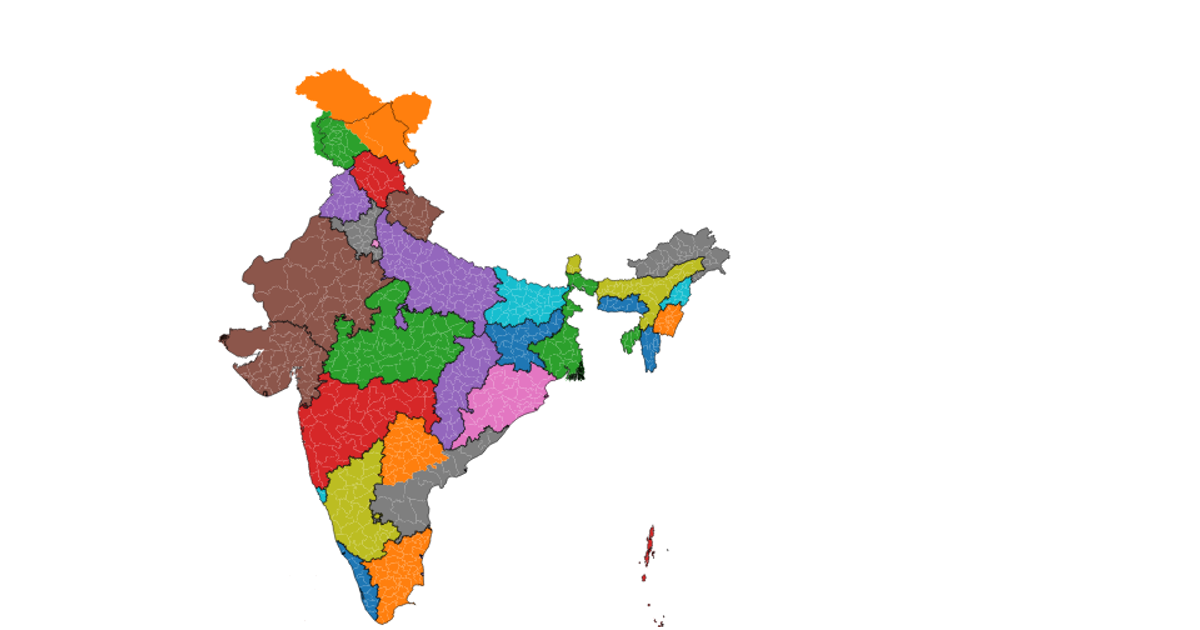
A dot density map of India renders each state as a colored polygon on a canvas, using a color-coding scheme where each state's RGB value encodes its index. The visualization projects geographic coordinates through a Mercator projection with d3.geoMercator, and draws the state boundaries using d3.geoPath and topojson. The rendering occurs entirely on a Canvas 2D context, with each polygon filled via a custom drawPolygon function that iterates through coordinate rings. The data comes from a remote TopoJSON file containing Indian state boundaries, loaded asynchronously with d3.json.
AI-generated descriptionDot density india
MIT Licensed







Comments
Sign in to join the discussion.