🌍 Public
Drawing a box
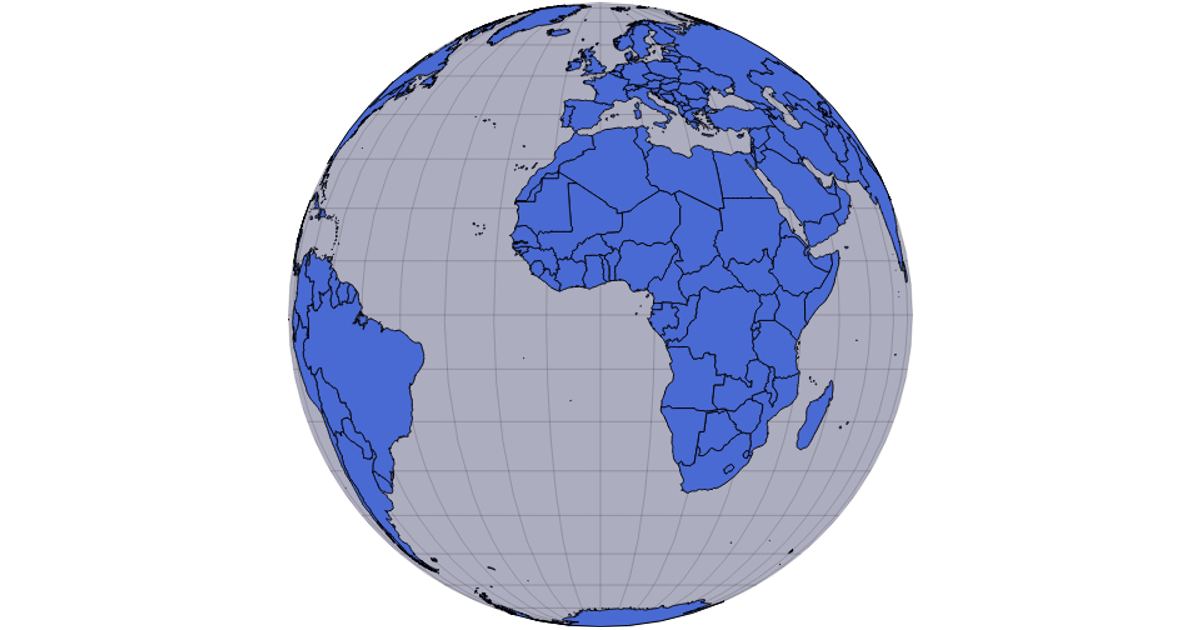
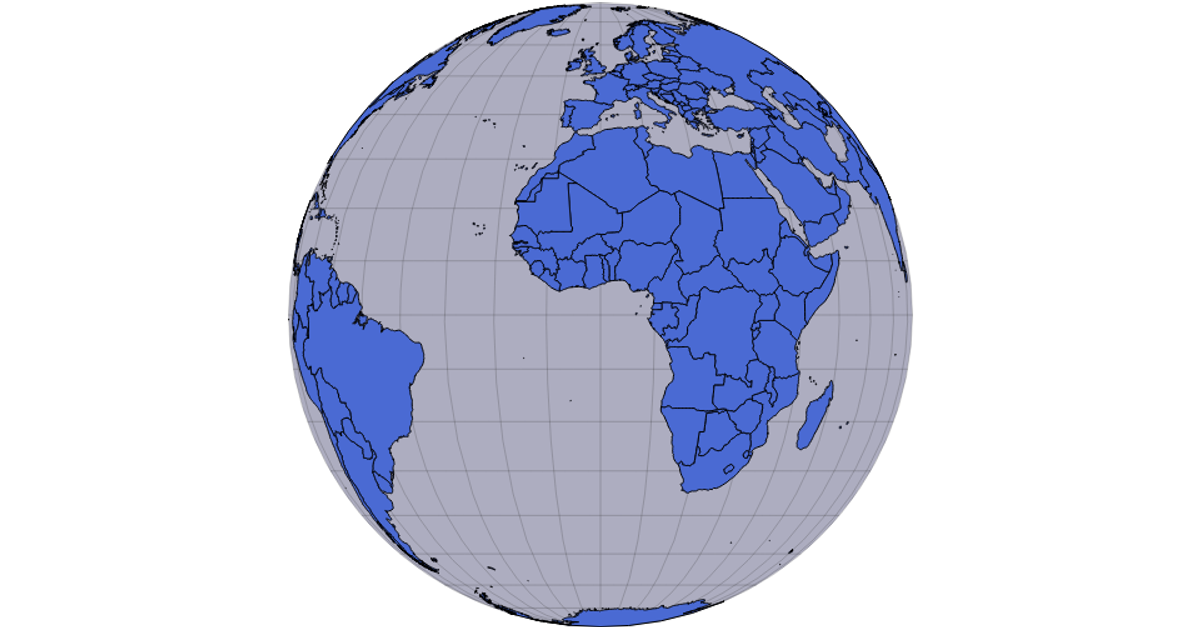
This interactive visualization displays a graticule, country boundaries, and a red rectangular region on an orthographic projection of the Earth. Users can drag to rotate the globe, using the d3.drag module to adjust the projection’s rotation, revealing the selected bounds. Built with d3-geo-projection.v3, it renders via SVG using d3.geoPath and d3.geoGraticule, with country data sourced from the world-atlas TopoJSON. The d3.zoom module enables panning and scaling of the entire graphic.
AI-generated descriptionMIT Licensed




Comments
Sign in to join the discussion.