🌍 Public
tree
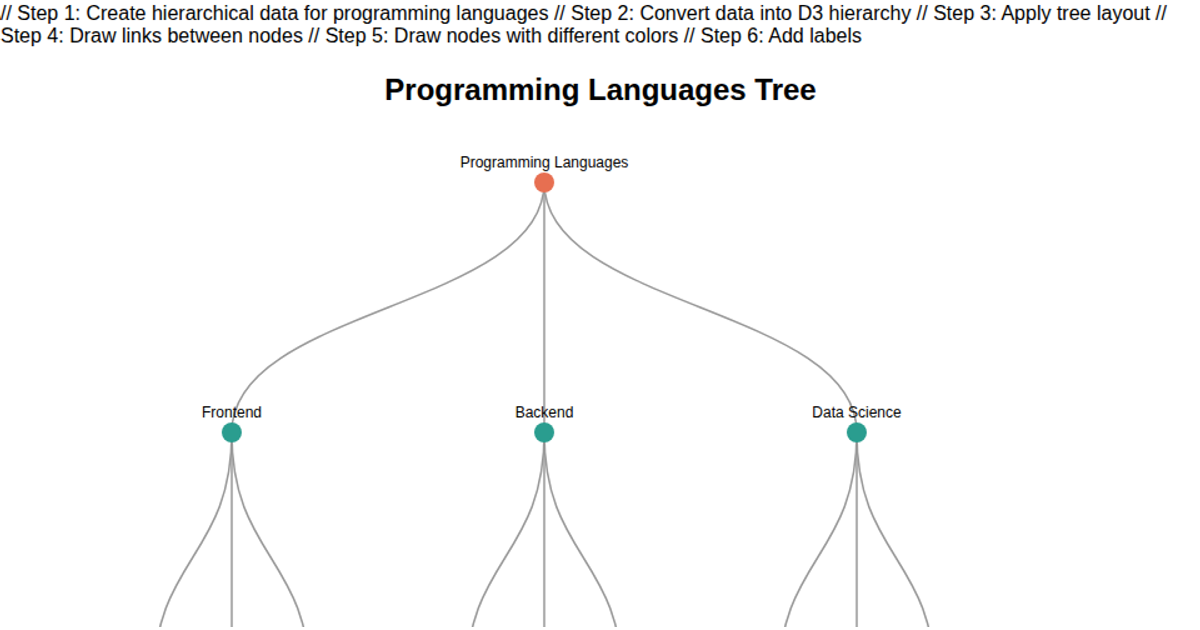
This tree visualization shows the hierarchical structure of academic fields, from a root "Science" node down to subfields and individual topics. The layout is generated by d3.hierarchy and d3.tree, with SVG paths representing links between nodes, styled with stroke colors. Node types (root, major, subfield, topic) are distinguished by shape—circles, rectangles, and ellipses—and color is applied per major scientific branch. The static rendering uses D3 v7 with a fixed 1600x900 pixel SVG canvas, positioning nodes with a computed tree layout rather than any animation or interaction.
AI-generated descriptionMIT Licensed



Comments
Sign in to join the discussion.