🌍 Public
Homework2(a1-cars.csv)-Zhenyong Ren
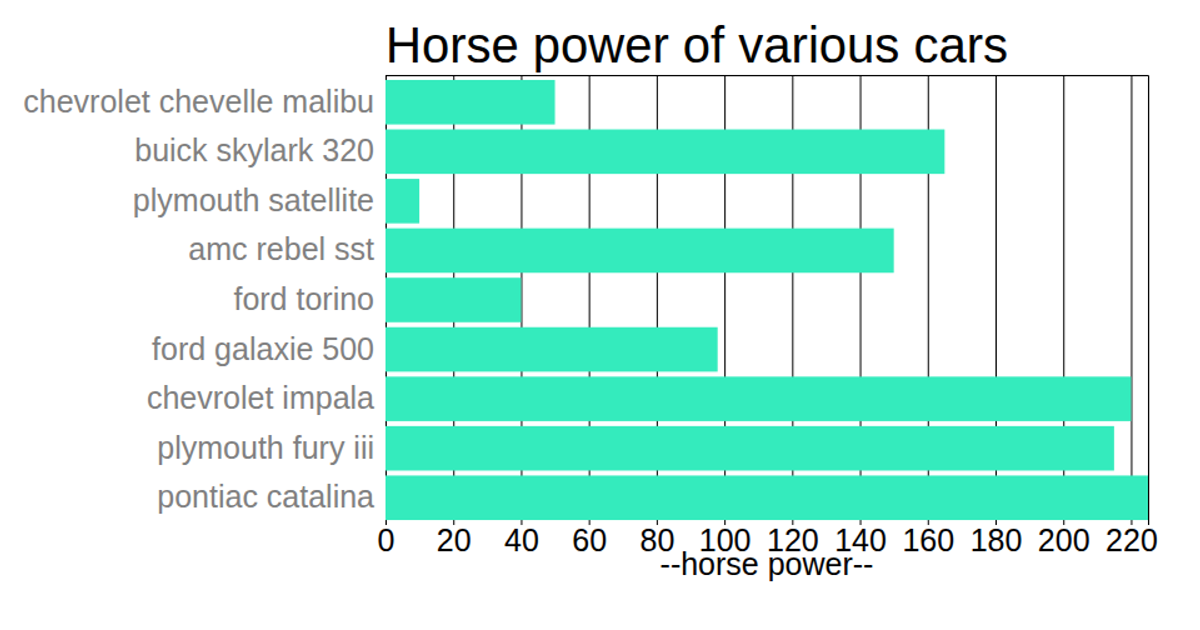
This visualization displays car data from the a1-cars.csv dataset, mapping acceleration values to horizontal bar lengths across car models. The chart uses D3 v5 with SVG rendering, employing `scaleLinear` for the x-axis, `scaleBand` for the y-axis, and `axisLeft`/`axisBottom` for labels. Acceleration values are multiplied by 1000 before drawing, and bars appear in steelblue via `g.selectAll('rect')`.
AI-generated descriptionMIT Licensed



Comments
Sign in to join the discussion.