🌍 Public
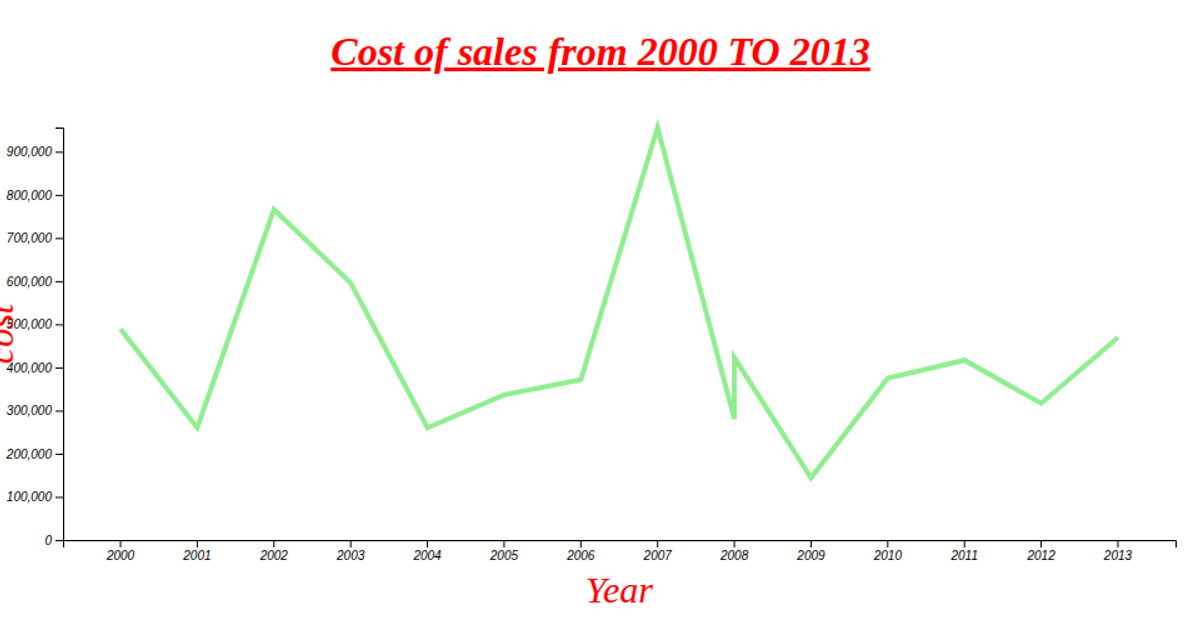
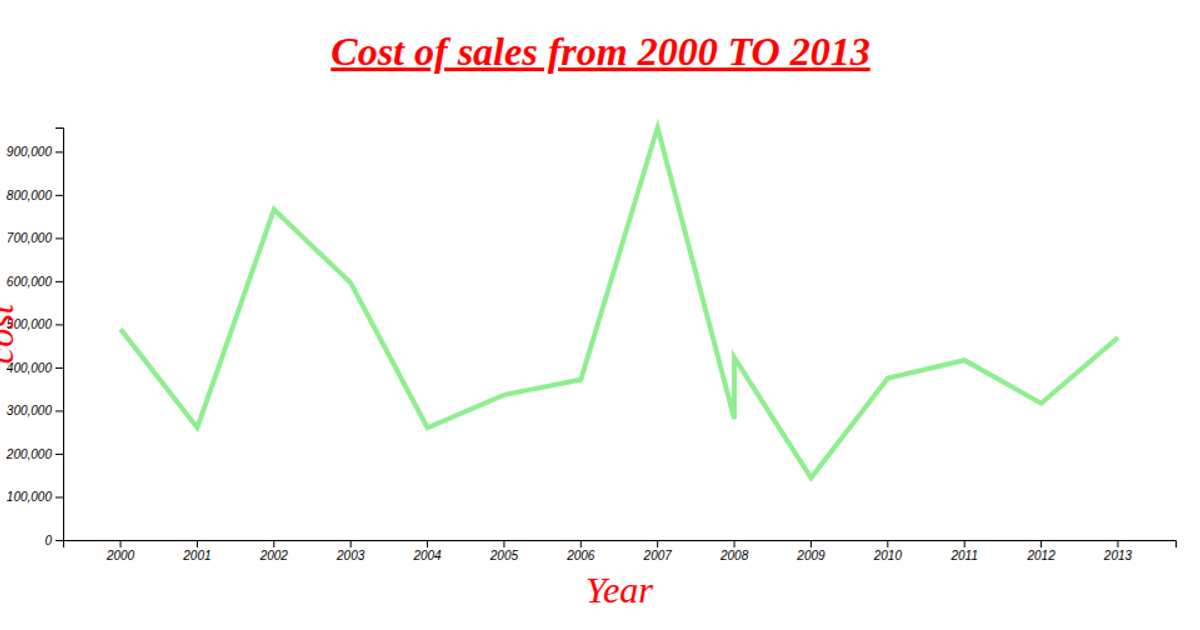
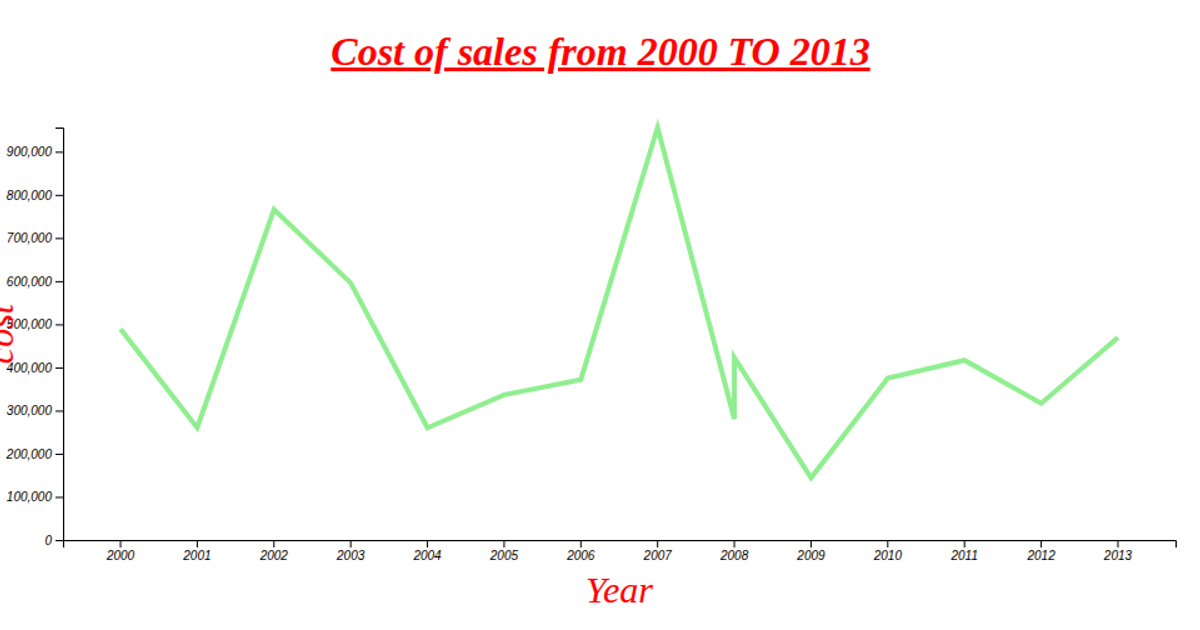
Anitha Shivaramaiah (11537410) - Line chart
This line chart displays earnings data from 2012 to 2023, plotting yearly cost values as a red path against a time-based x-axis and linear y-axis. The visualization loads CSV data from a GitHub gist, parses it with `d3.csv`, and renders using SVG inside a React framework. Axes are generated with `d3.axisBottom` and `d3.axisLeft`, while the line is constructed via `d3.line` and scales using `d3.scaleTime` and `d3.scaleLinear`.
AI-generated descriptionA bare minimum HTML page demonstrating use of CSS and JavaScript.
See also React Starter.
MIT Licensed




Comments
Sign in to join the discussion.