🌍 Public
project_nh
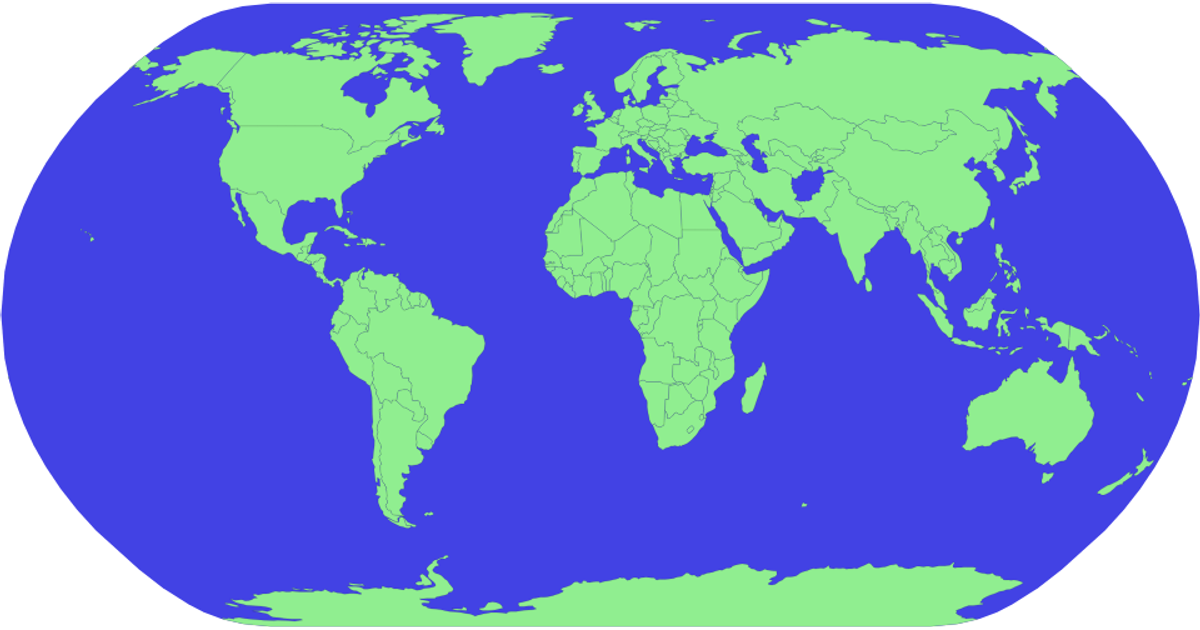
This example displays a globe with countries rendered in light green against a blue sphere, using SVG. The visualization leverages D3.js version 5 and TopoJSON to load and project geographic data. The code constructs the map using `d3.geoPath` and `d3.geoNaturalEarth1` for projection, while `d3.select` and `d3.arc` handle basic DOM manipulation. It demonstrates fundamental SVG element creation and styling through D3’s selection methods, with the final output framed in a fixed 960 by 500 pixel viewport.
AI-generated descriptionDemonstrates fundamental DOM manipulation using D3.js by making a smiley face whose eyebrows move.
MIT Licensed




Comments
Sign in to join the discussion.