🌍 Public
Corona Virus LineChart with Margin
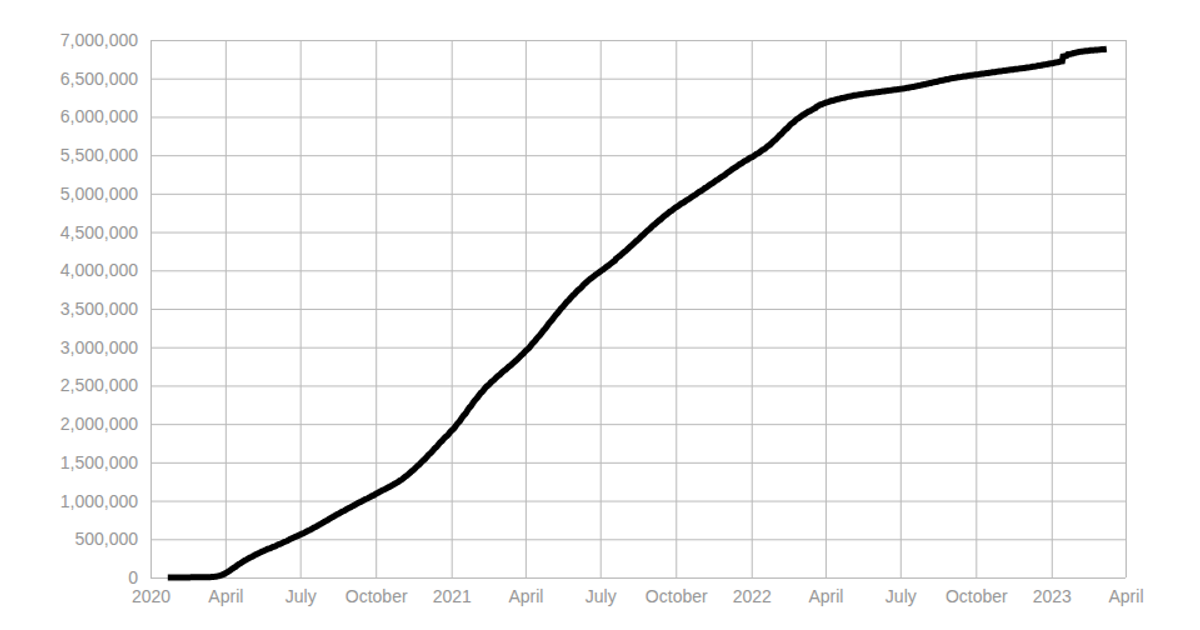
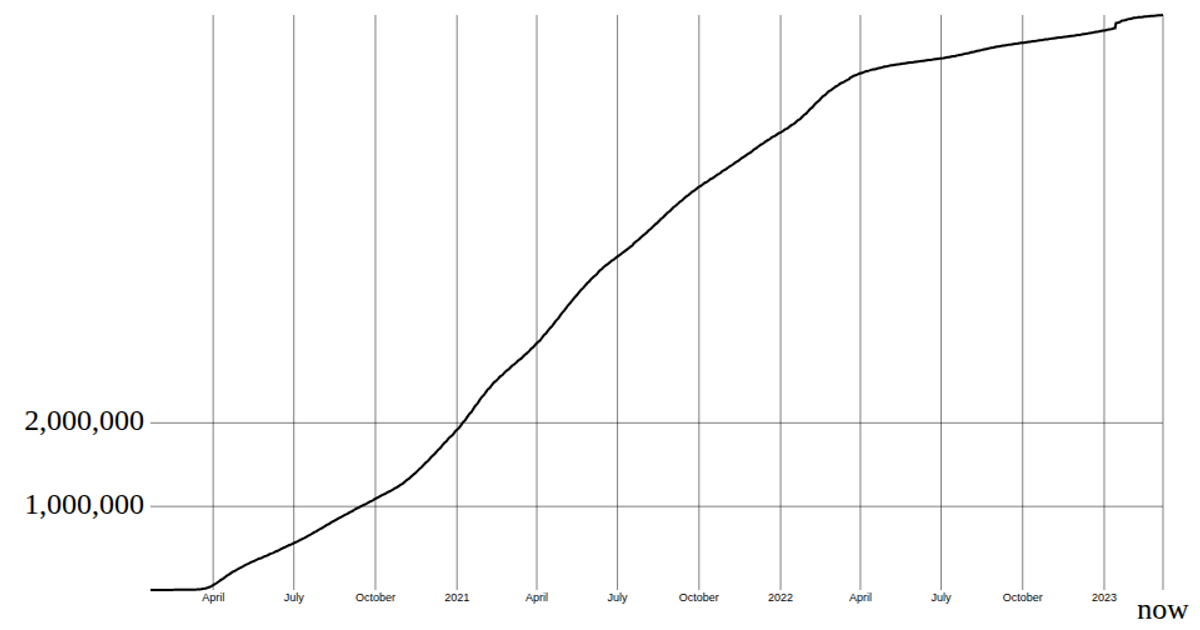
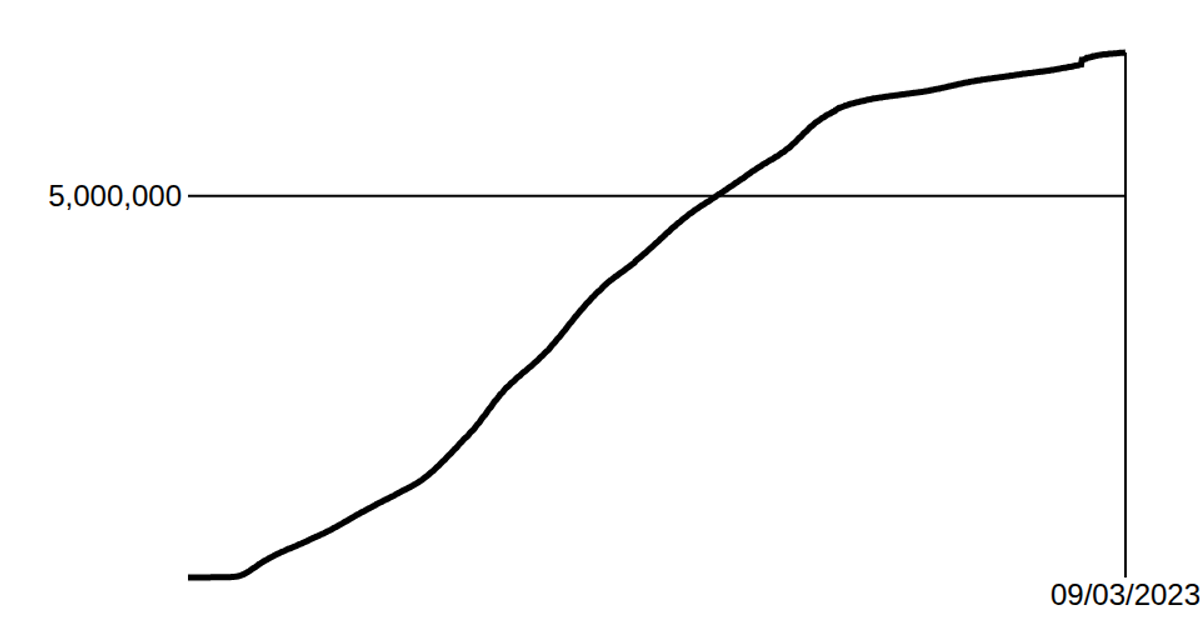
This example displays a global COVID-19 death toll line chart, highlighting the moment cumulative deaths reach six million with horizontal and vertical marker lines. Built with React and D3 v5, it uses `d3.scaleTime` and `d3.scaleLinear` to map dates and death counts, while `d3.line` generates the SVG path. Data is fetched and parsed from a CSV URL via `d3.csv` and `d3.timeParse`.
AI-generated descriptionSmiley face implementation with React & D3, using a React component.
MIT Licensed





Comments
Sign in to join the discussion.