🌍 Public
Fork of Fork of countries
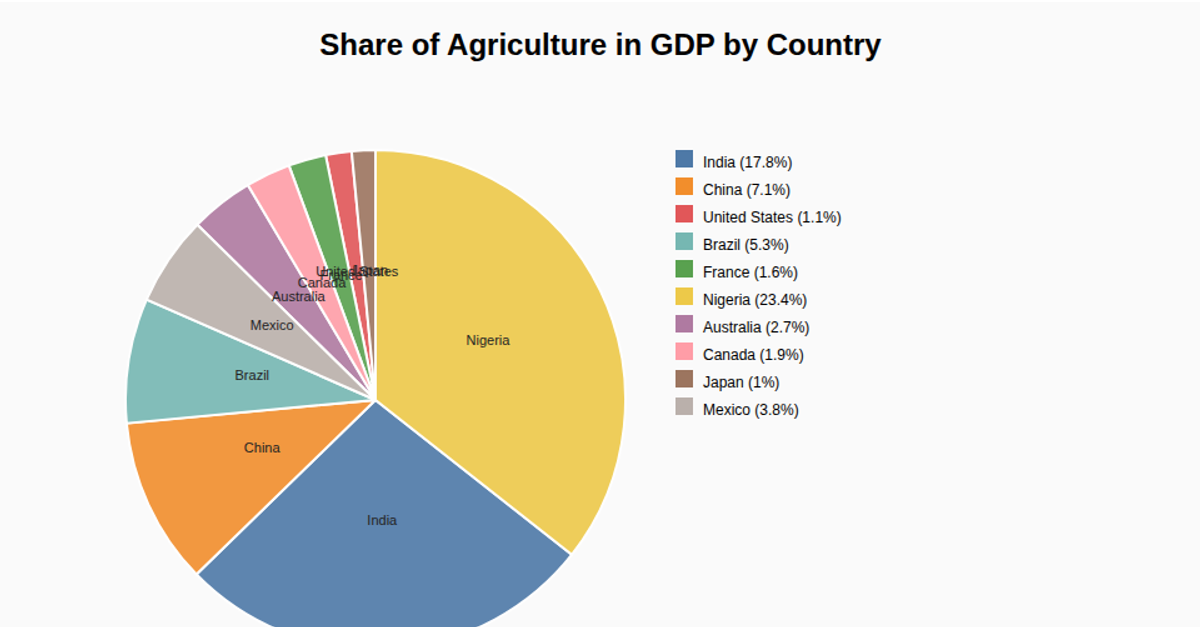
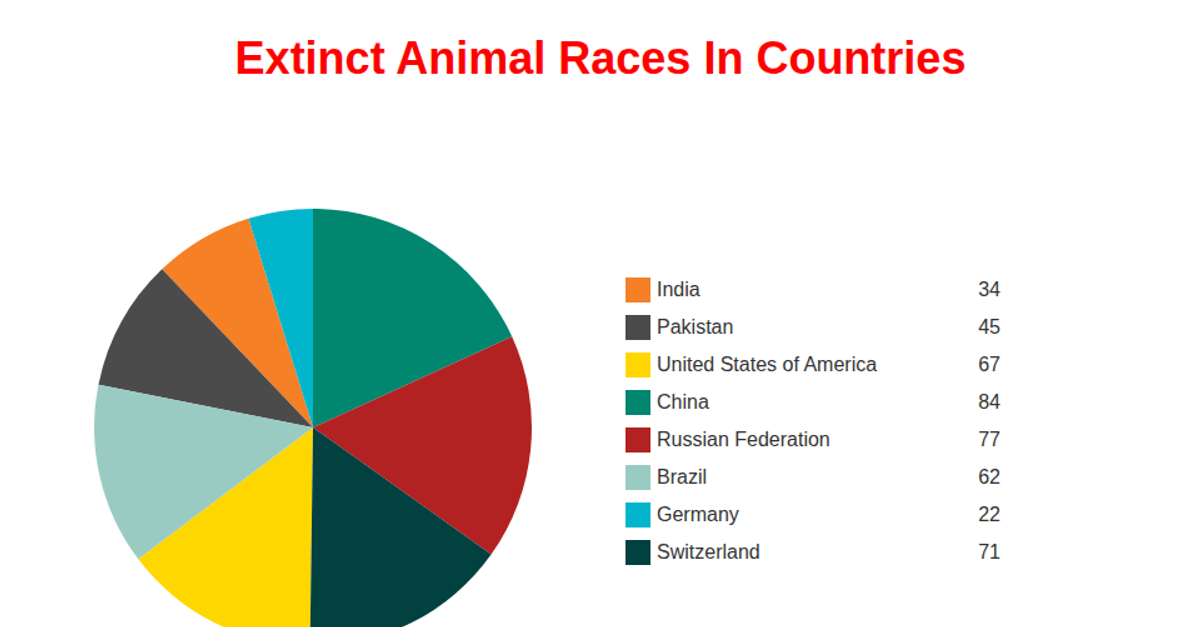
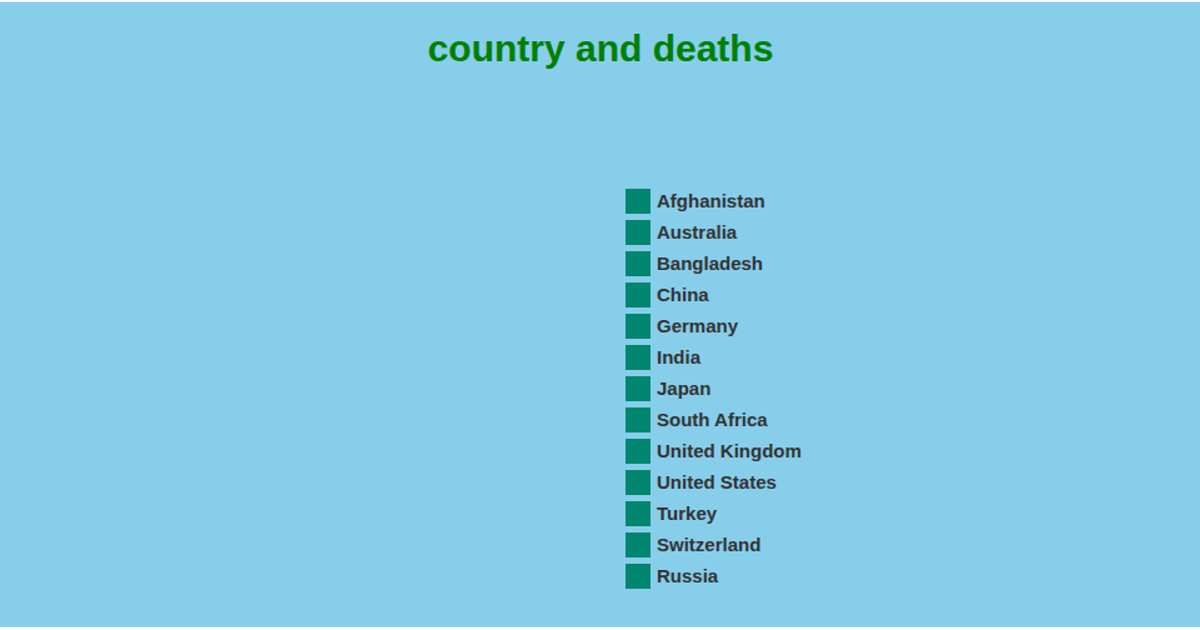
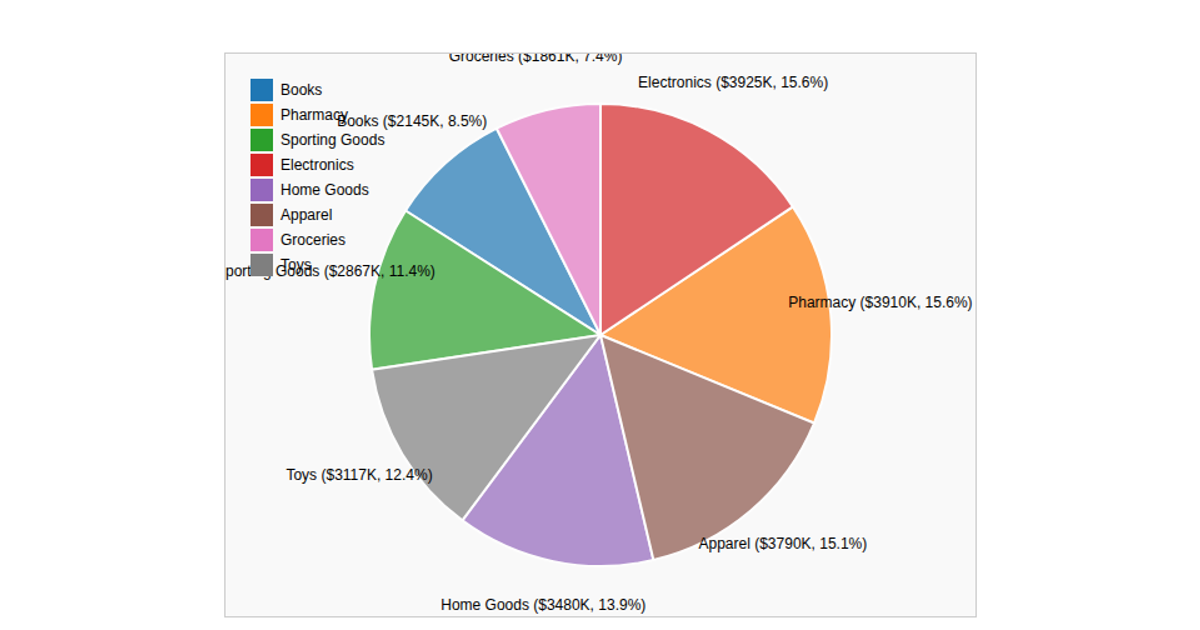
This example displays a pie chart of sales records, with each slice representing data grouped by country. The visualization renders using SVG and reads its data from a CSV file hosted online via `d3.csv`. The code uses `d3.pie`, `d3.arc`, and `d3.scaleOrdinal` to generate the slices and assign colors to each segment. Each slice is labeled with its value, and a legend is drawn on the right side. The chart is generated by fetching data with `d3.csv` from a provided URL, then iterating through the records to sum the `orderdate` values for the total.
AI-generated descriptionMIT Licensed




Comments
Sign in to join the discussion.