🌍 Public
Scatter
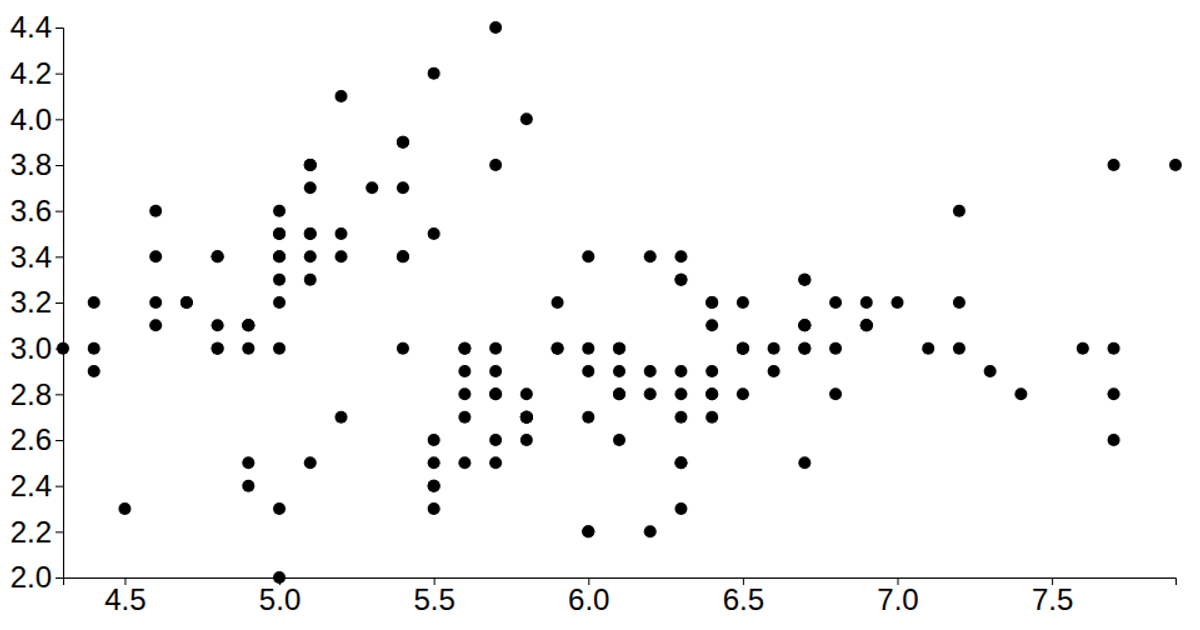
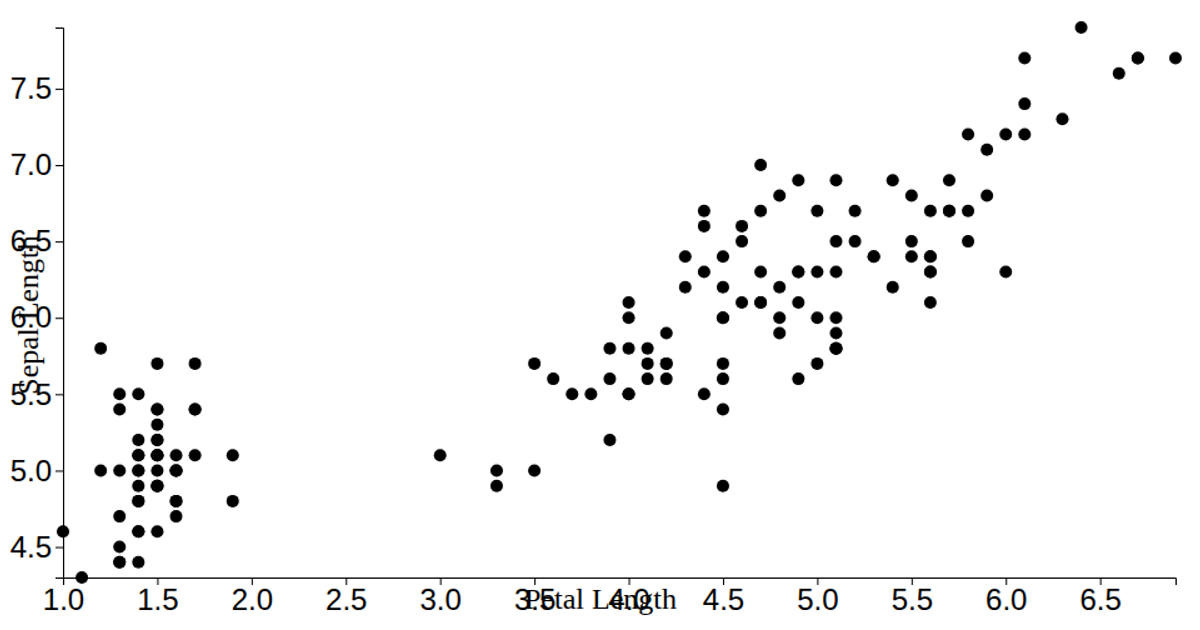
This scatter plot visualizes the Iris dataset, mapping petal width against sepal length for each sample. Built with D3 v6, it uses `scaleLinear`, `extent`, and `axisLeft`/`axisBottom` to render the axes and circles. The SVG is dynamically sized to the window, and the plot is encapsulated in a custom `scatterPlot` function with configurable margins, radius, and accessor functions. The code also includes commented-out code for cycling through different variables, and a custom Share Tech font styles the text.
AI-generated descriptionShows the Iris Dataset.
MIT Licensed




Comments
Sign in to join the discussion.