🌍 Public
Gráfico de Dispersión
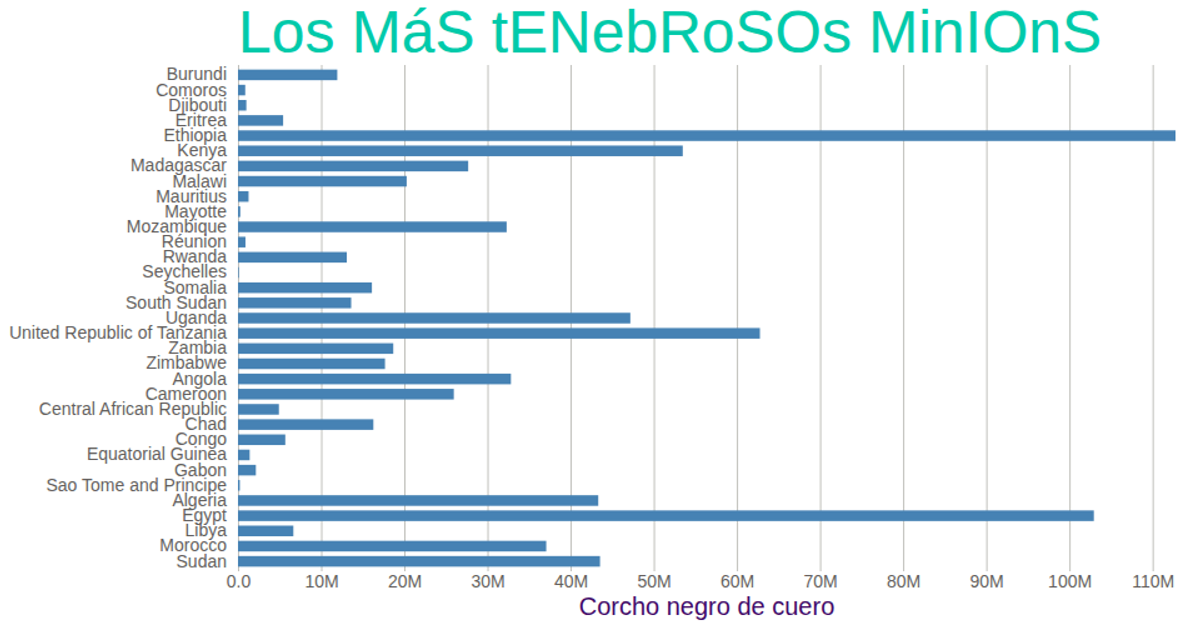
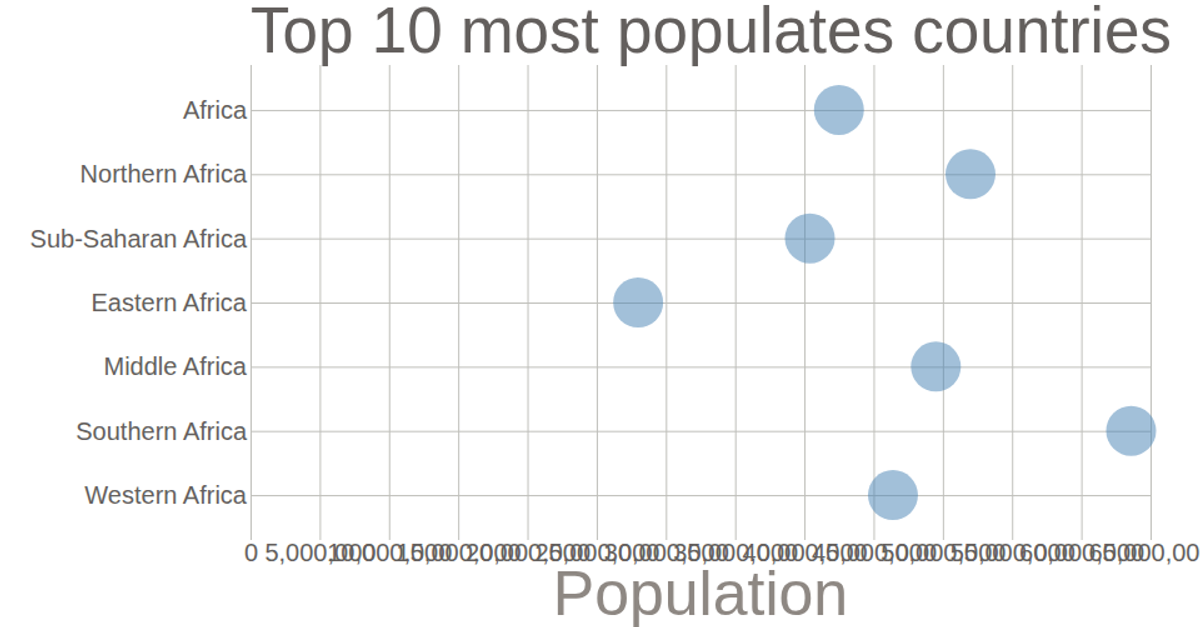
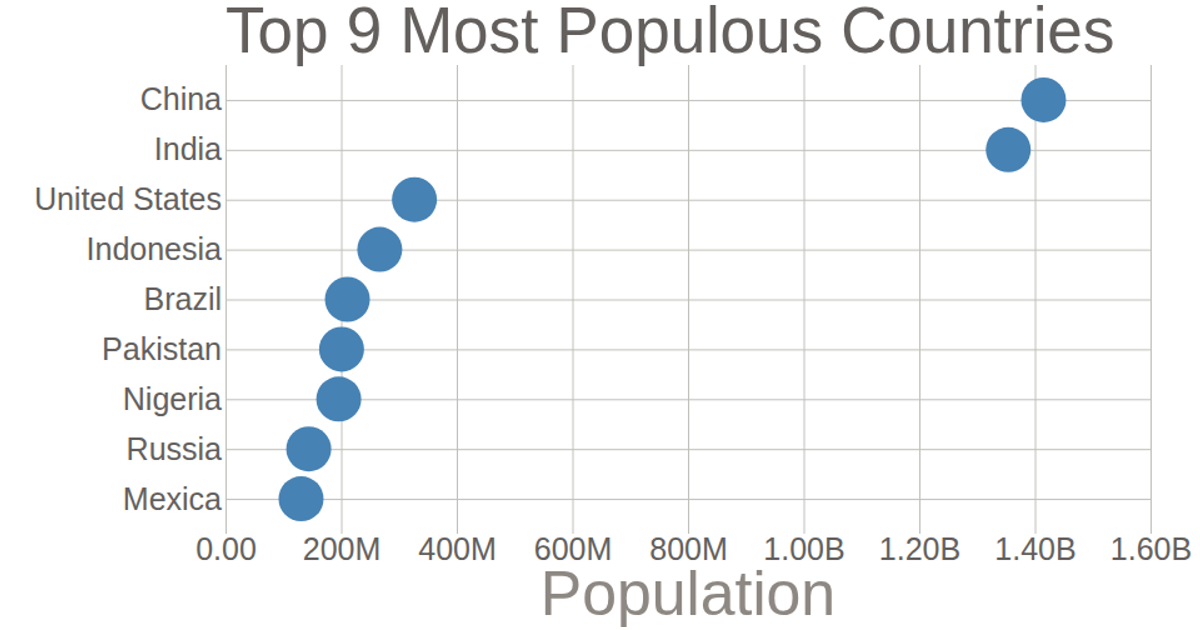
A scatterplot displays population figures for nine African countries, with each country positioned along the y-axis and its population along the x-axis. D3.js renders circular marks onto an SVG canvas, using `scaleLinear` for the quantitative axis and `scalePoint` for the categorical country labels. Grid lines extend from both axes, and formatted tick labels abbreviate large numbers using `format('.2s')`. The data is loaded from a CSV file and multiplied by 1000 before visualization.
AI-generated descriptionMIT Licensed




Comments
Sign in to join the discussion.