🌍 Public
Map of NY counties with fips code
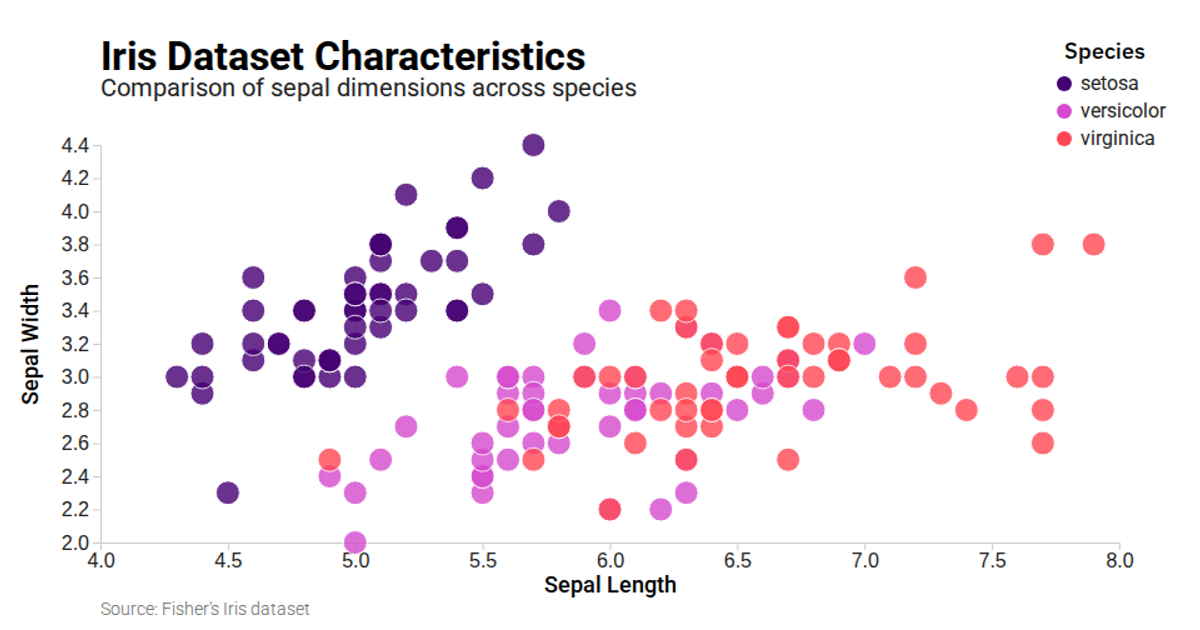
A scatter plot displays iris flower measurements, comparing sepal length against sepal width for three species. Color-coded points distinguish species identities, with an interactive legend that highlights selected categories while dimming others, supported by a hover state. The visualization loads data from a CSV using d3.csv and renders scales with d3.scaleLinear, axes with d3.axisBottom and d3.axisLeft, and ordinal colors via d3.scaleOrdinal. A responsive layout adapts to container dimensions using ResizeObserver.
AI-generated descriptionMIT Licensed




Comments
Sign in to join the discussion.