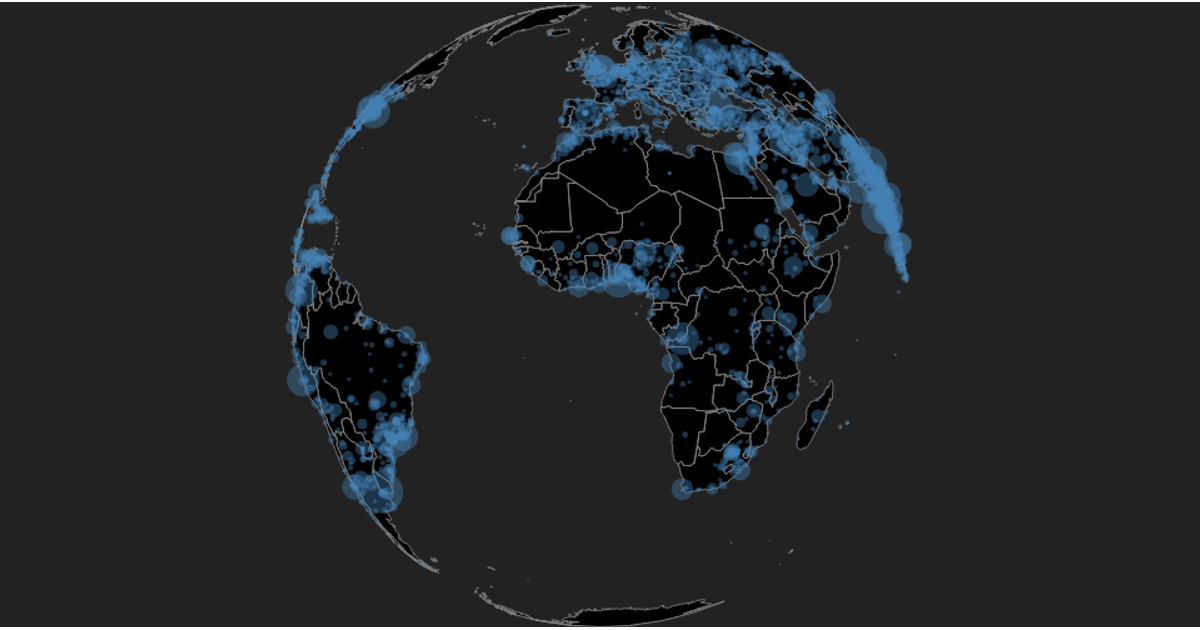
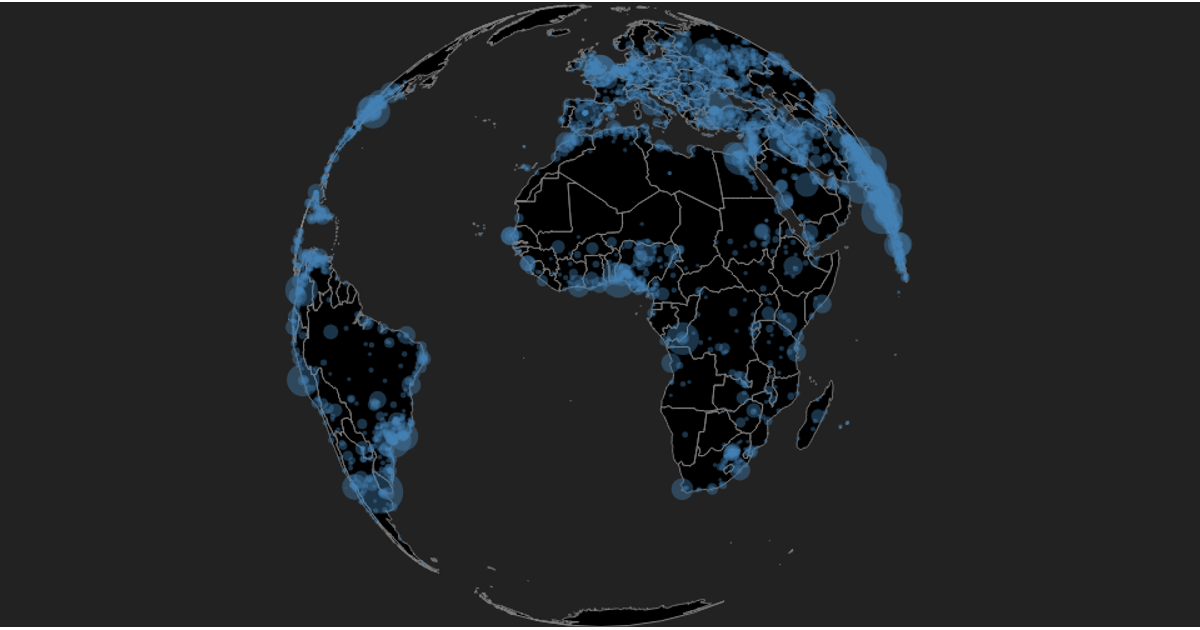
Alumni by City on a Globe
This example displays a rotatable globe with circles marking cities of over 100,000 inhabitants, sized by population and colored steelblue. Users can drag to rotate the projection and zoom via the d3.zoom handler, switching between low- and high-resolution country boundaries from the TopoJSON World Atlas. The visualization uses d3.geoOrthographic, d3.geoPath, and d3.drag, with a d3-tip tooltip showing each city’s name and population. City data comes from a preprocessed Geonames CSV file.
AI-generated descriptionA globe with pan & zoom showing circles for each city of over 100,000 inhabitants. Data from Geonames, preprocessed. The same data is used in World City Explorer.
Uses world-110m and world-50m geographic shapes from TOPOJSON World Atlas.
Inspired by
forked from <a href='http://bl.ocks.org/curran/'>curran</a>'s block: <a href='http://bl.ocks.org/curran/0bb64d8f56042e2480c908b0985f063b'>Orthographic Zoom III</a>
Imported to VizHub from bl.ocks.org: Cities on the Globe





Comments
Sign in to join the discussion.