🌍 Public
Fork of SPLOM
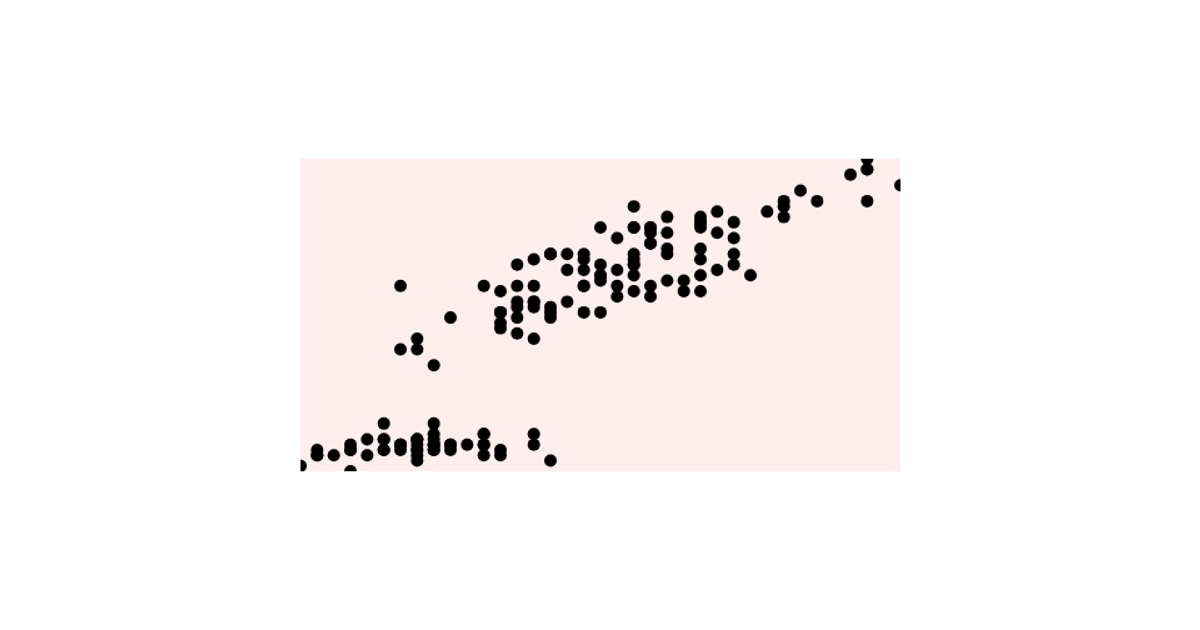
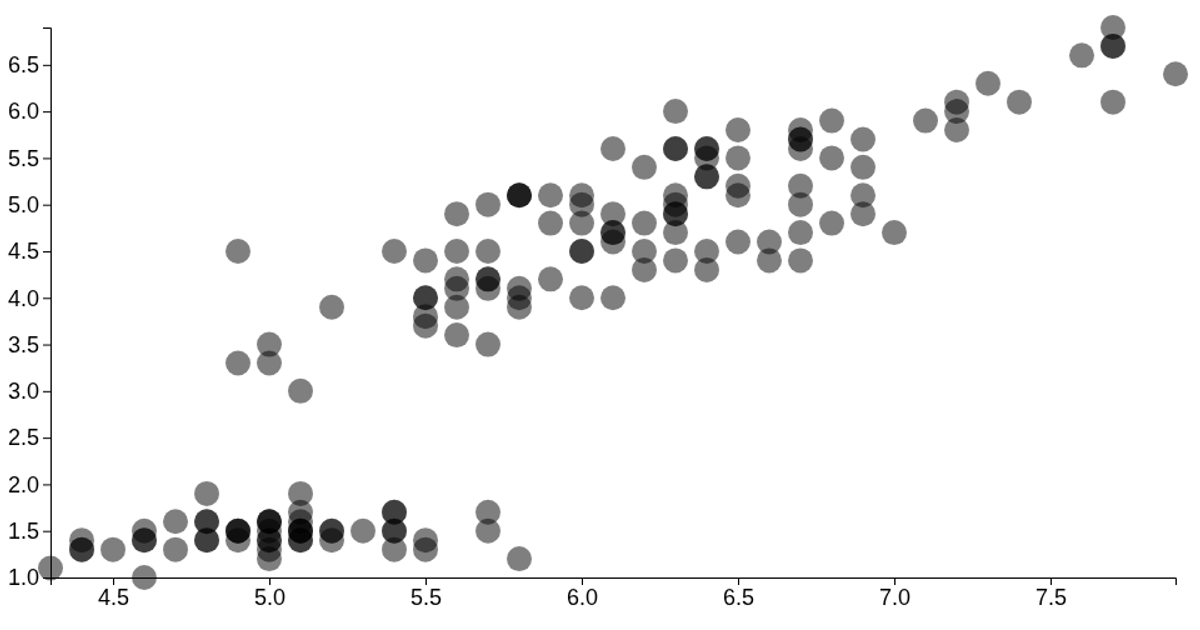
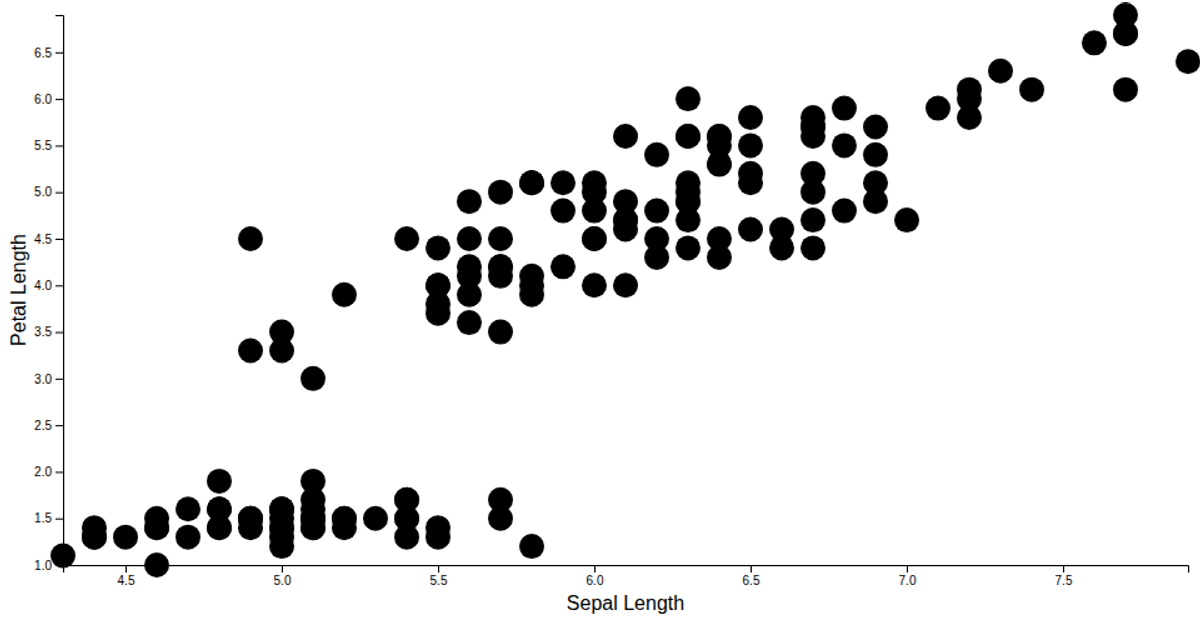
This visualization displays a scatter plot matrix of the Iris dataset, comparing pairs of sepal length, sepal width, petal length, and petal width across a 4×4 grid. Each cell shows the relationship between two quantitative columns using circles with a radius of 2 pixels. The code uses D3 v6 APIs including `csv`, `scaleBand`, `scaleLinear`, and `extent`, with a custom `scatterPlot` factory function managing the scales. Data loads from a GitHub Gist URL, and the SVG rendering fills the entire window.
AI-generated descriptionA minimal scatter plot matrix of the Iris Dataset.
ISC Licensed




Comments
Sign in to join the discussion.