🌍 Public
Activity8Task1_UN
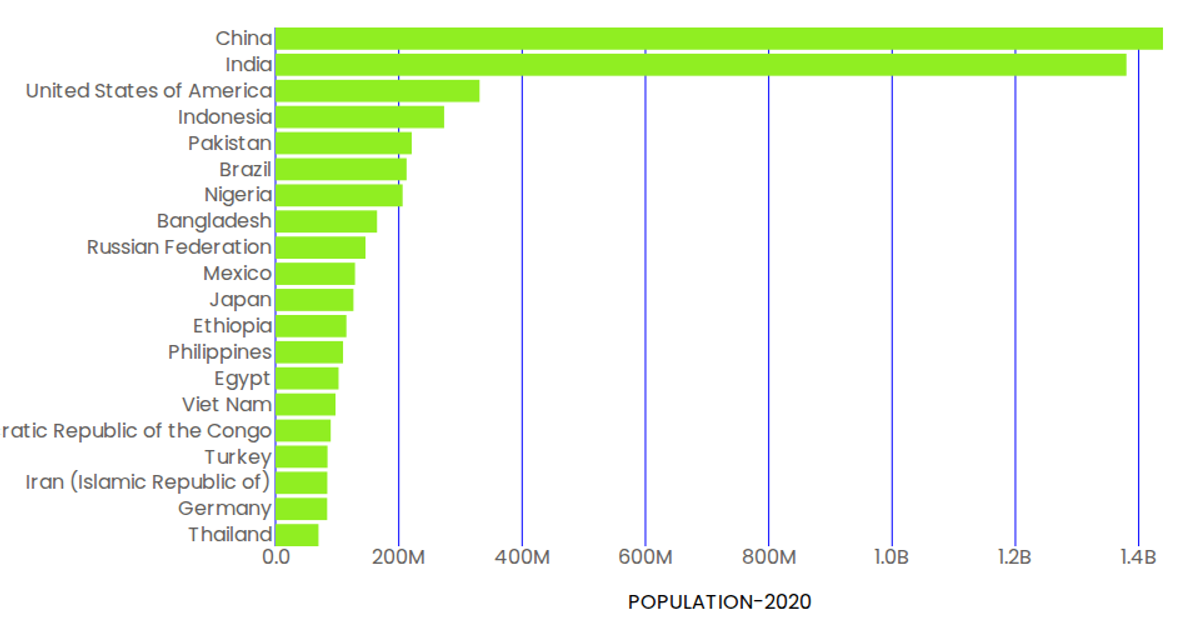
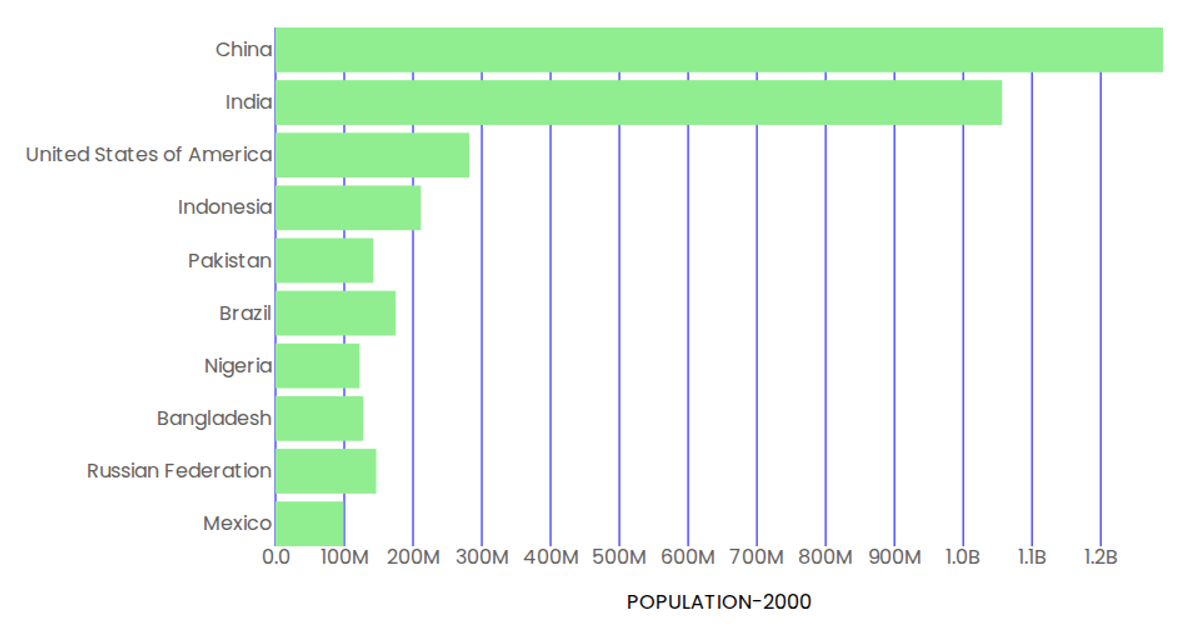
This example displays a horizontal bar chart of the 2020 populations for ten countries, with bars extending rightward from the y-axis. The chart is built with React and rendered as an SVG, using D3 v5’s `scaleBand` and `scaleLinear` functions for axis scaling. Data is loaded from a CSV file via D3’s `csv` parser. The x-axis tick labels are formatted using D3’s `format` function to abbreviate large numbers, and tooltips show the same abbreviated values.
AI-generated descriptionMIT Licensed





Comments
Sign in to join the discussion.