🌍 Public
Political Contributions by Sports Owners
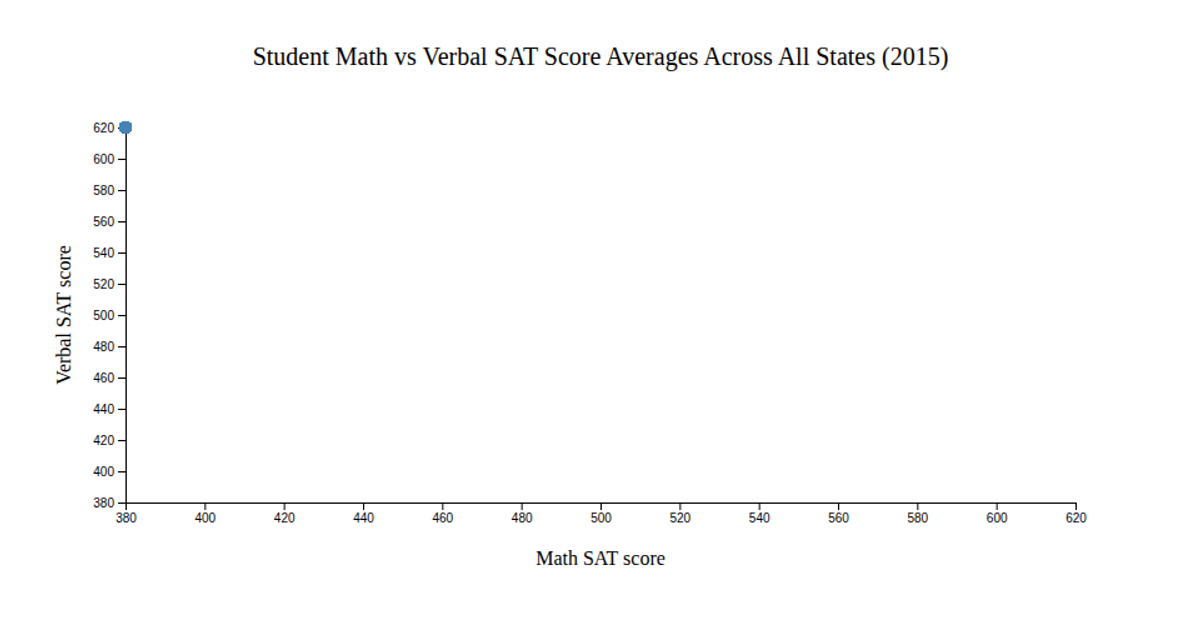
This visualization displays a scatter plot of student math versus verbal SAT scores for all states in 2015. Each circle represents a state, positioned by its average scores and sized by the number of test takers. Colors are determined by whether the state's mathematics GPA is above or below 3.5. The chart uses D3 v7 with `d3.scaleLinear` for axes and circle sizing, `d3.scaleOrdinal` for color mapping, and `d3.csv` to load the `satscores.csv` file. Interactive hover effects, implemented via CSS, change point color. The SVG rendering includes a color and size legend for interpretation.
AI-generated descriptionMIT Licensed


Comments
Sign in to join the discussion.