🌍 Public
Bar Chart Tutorial
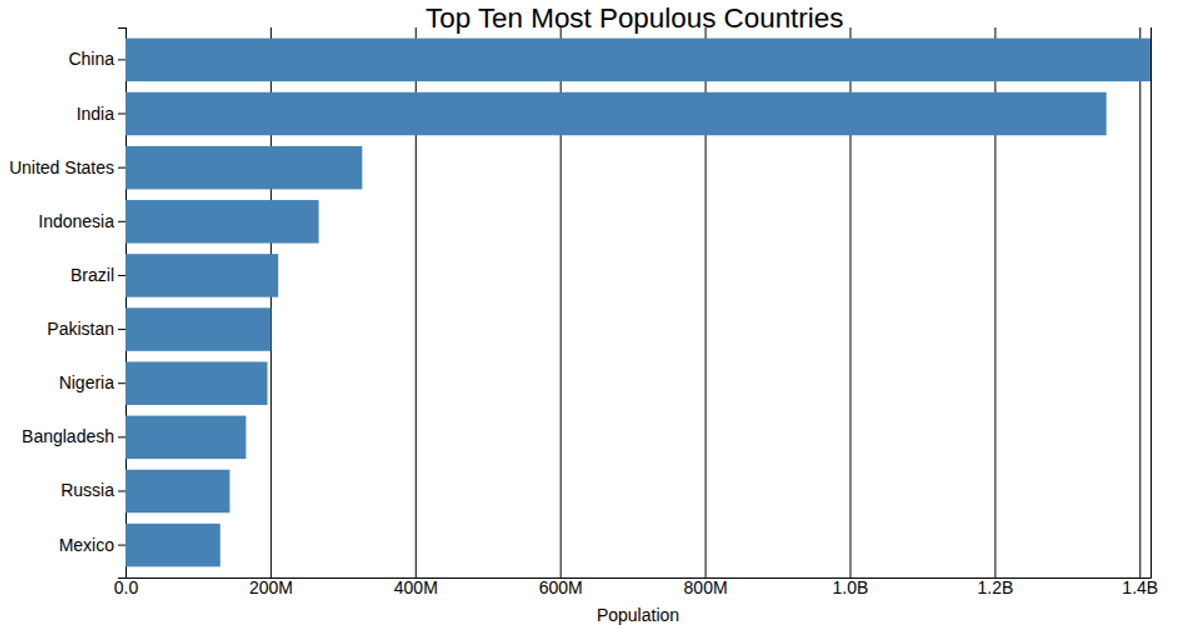
This bar chart displays the populations of the ten most populated countries in 2018, using horizontal bars. The data, sourced from the World Bank Group and loaded from a CSV file, is scaled and rendered as an SVG. The visualization uses D3's `scaleLinear`, `scaleBand`, `axisBottom`, and `axisLeft` APIs to construct the plot, with population values divided by 1000 for the x-axis.
AI-generated descriptionThis chart shows population of the 10 most populated countries in the world as per 2018. Data taken from World Bank Group
MIT Licensed




Comments
Sign in to join the discussion.