🌍 Public
Montisenho Natural Park Map
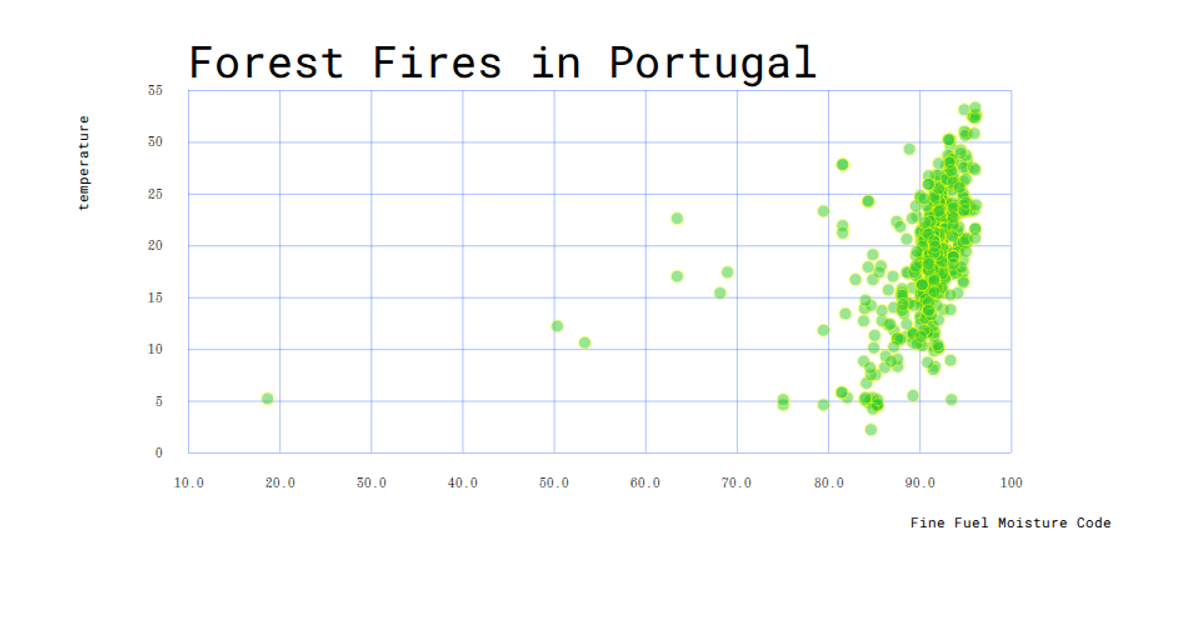
Montisenho Natural Park Map visualizes forest fire records from the UCI Forest Fires dataset as an interactive scatterplot overlaid on a geographic-inspired grid. Each point represents a recorded fire event, positioned by X and Y coordinates, with point size encoding the burned area and color encoding the Fire Weather Index (FWI) or temperature. The visualization uses D3.v7 with SVG rendering to draw the park-like layout, with axes labeled by grid coordinates, a legend for the color scale, and hover tooltips revealing fire weather indices. The map highlights seasonal and monthly fire patterns across the park's spatial zones.
AI-generated descriptionMIT Licensed




Comments
Sign in to join the discussion.