🌍 Public
sanky
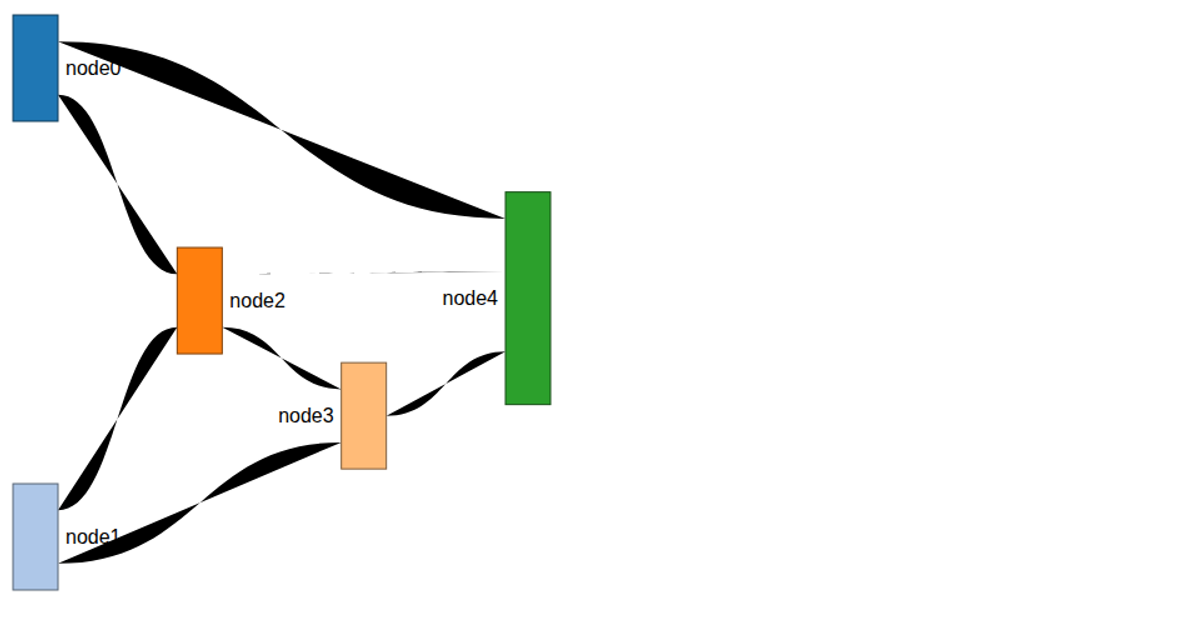
This Sankey diagram visualizes the flow of production values from three economic sectors—Agriculture, Manufacturing, and Services—into Domestic Consumption and Exports. The code uses the `d3-sankey` library's `d3.sankey()` generator and `d3.sankeyLinkHorizontal()` function to compute node and link positions, rendered as SVG paths and rectangles. Node labels are positioned left or right based on their x-coordinate. The bundled React component initializes the D3 chart inside a `useEffect` hook and uses an ordinal color scale for node and link coloring.
AI-generated descriptionMIT Licensed




Comments
Sign in to join the discussion.