🌍 Public
Fork of Viet refugees
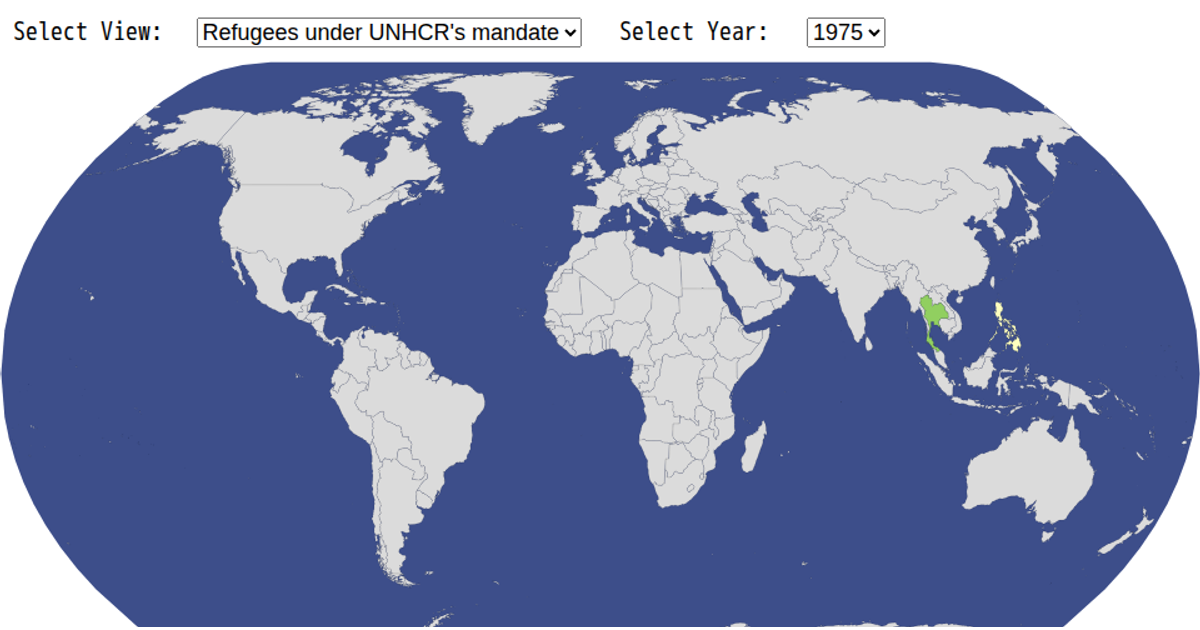
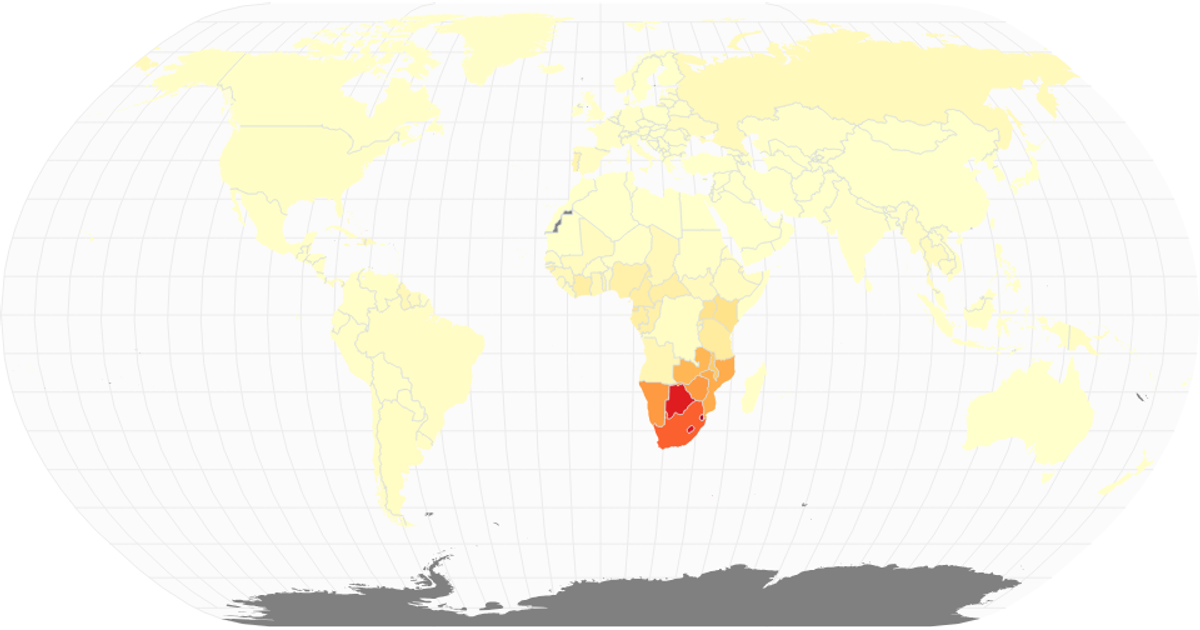
This map visualizes the number of refugees under UNHCR’s mandate by country for a given year. The visualization uses a natural Earth projection to render world geography, with each country colored according to its refugee count using a red-yellow-green sequential color scale. The map is rendered as SVG, and the code leverages D3’s `geoPath`, `geoNaturalEarth1`, `scaleOrdinal`, and `schemeRdYlGn` to project, color, and display the data. Country data is loaded from a CSV file, while the geographic boundaries come from the world-atlas package.
AI-generated descriptionMIT Licensed



Comments
Sign in to join the discussion.